Conducting analysis using ArcGIS Online tools
0. Summary:
In this step we will be creating three (3) different type of maps to support our story.
- Heat map
- Proportional symbology
- Map bases on joined data
1. Access your Content workspace to create your own feature service:
- Navigate to UM’s ArcGIS Online Portal (https://univmb.maps.arcgis.com) and ensure you are signed in.
- Access the Content area by clicking on that option in the top navigation.
2. Add Item to create a feature service from a .csv file:
We want to add our tree data to our Content area in the form of a feature service so that we can publish content with it.
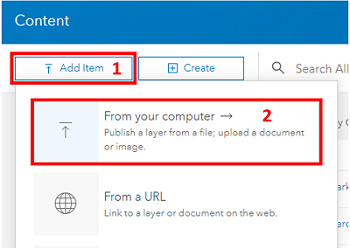
- Select the Add Item option from the top left of your content area.
-
From the options that appear we want to select the From your computer option to select to .csv file from your downloaded data.
- Navigate to your TreeInventory_KingsPark.csv file and add it.
In the Dialogue Box that follows:- Title: SomethingMeaningful_yourinitials
- Tags: 7200_yourinitials
- Check off the option to publish the file as a hosted layer.
- Double-check your field types and location fields: Diameter at Breast Height should be a double, Latitude and Longitude set as the location fields.
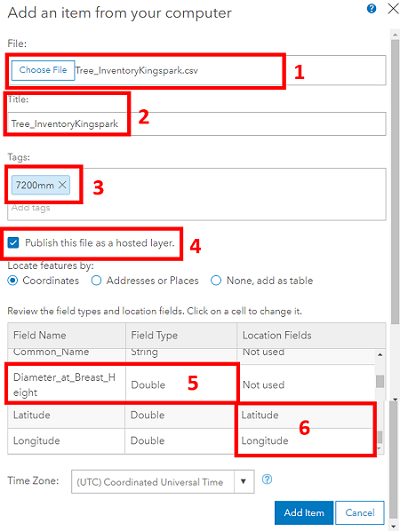
- Click the Add Item button, and wait while your service publishes.
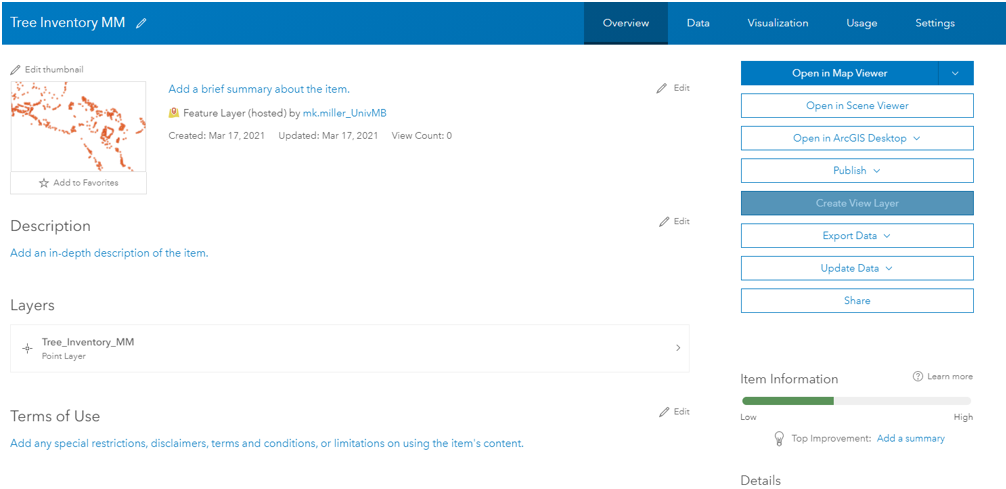
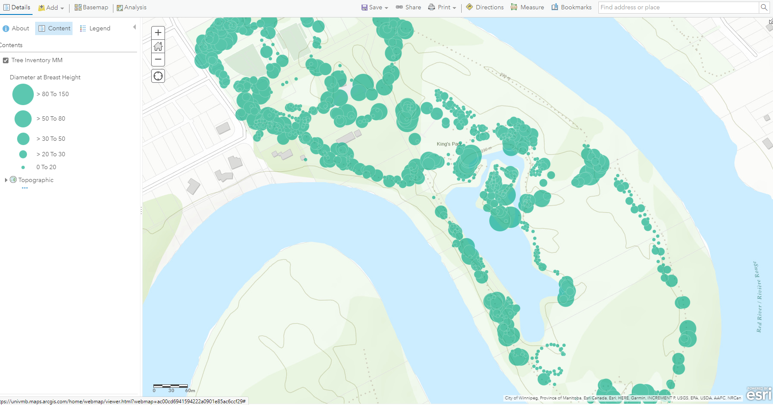
- You should now have your own feature service to use that looks something like:
3. Create a heat map do show distribution.
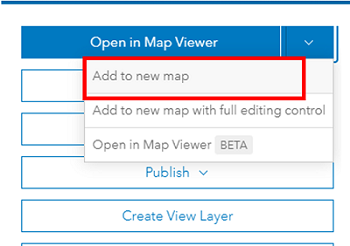
- Click the dropdown arrow beside the Open in Map Viewer option at the top of the list of options on the right side of your feature service window.
-
Select the add to new map option. The data may take a couple of seconds to load.
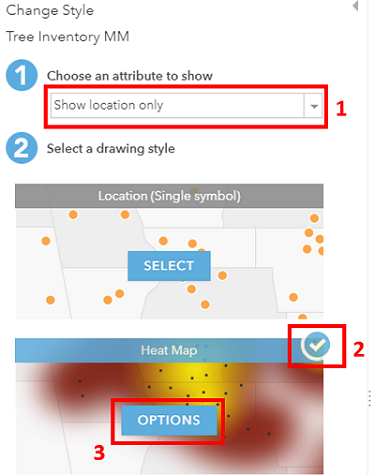
- The style options should open automatically in your Table of Contents.
- Choose an attribute to show: Show location only
- Drawing style: Heat Map
- Select options for Heat Map
-
In the Symbology options that open select the small icon on the right and select a colour ramp that works for you.
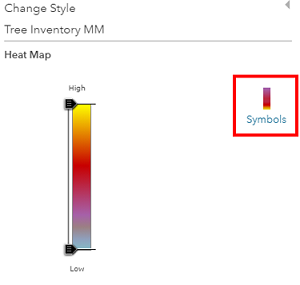
-
Click OK and then Done at the bottom of the Table of Contents. Your map should look something like:
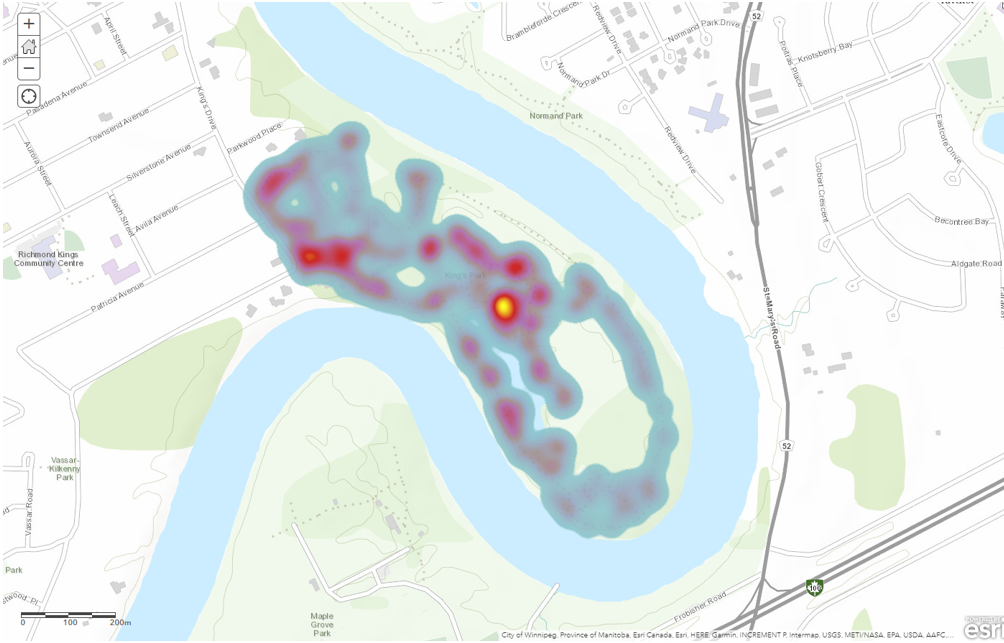
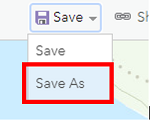
- Save a copy of the map to your personal content area by selecting the Save As option. Call it something meaningful and be sure to add your initials to the end of the filename.
4. Access your Map workspace as another way to create a new map:
-
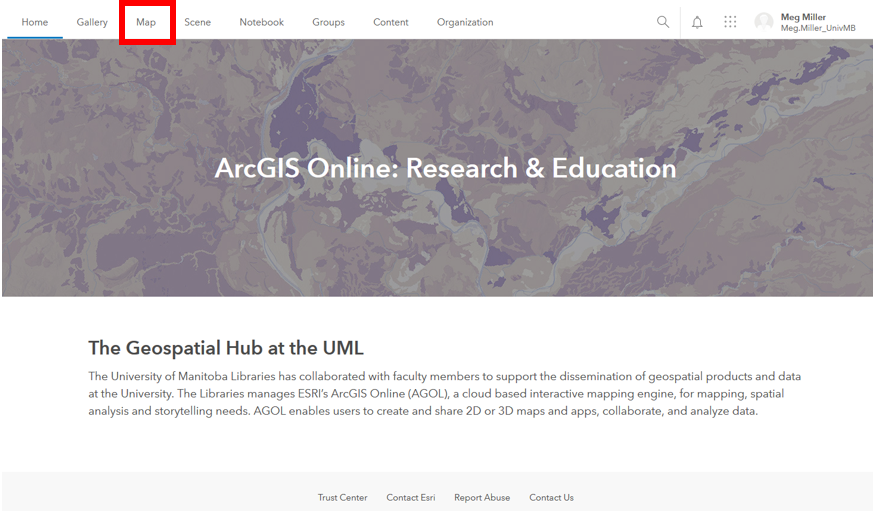
Access the Map area by clicking on that option in the top navigation. This will open the last map you were working on.
-
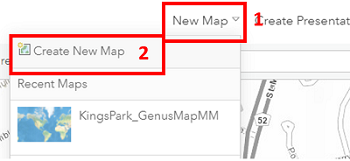
At the top of your screen to the left of your user name select the New Map option, then Create New Map. You now have an empty map.
- Save your new map as TreeDiameterMap_yourinitials
-
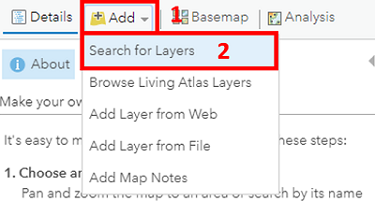
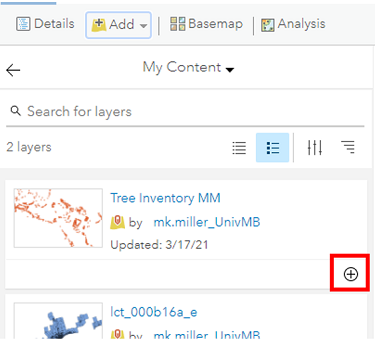
To add our feature service to the map select the add option above the Table of Contents and then Search for Layers.
-
Your search option will default to My Content where the feature service you created is saved. Click the plus sign in its bottom right corner to add to the map.
- Save your changes.
-
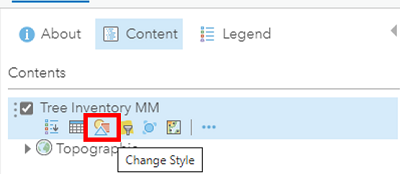
Return to the Content area of your Table of Contents to change symbology. The third tile from the left (3 stacked shapes) is the option to change styles.
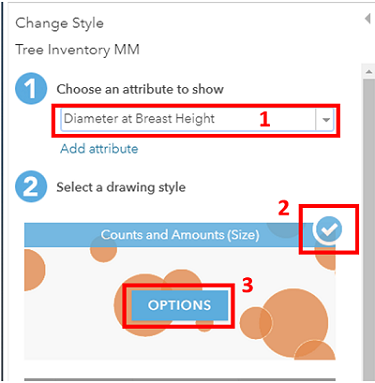
- In the Styles dialogue that opens:
- Attribute: Diameter at Breast Height
- Drawing Style: Counts and Amounts (size), then select options.
- In the Counts and Amounts dialogue that opens:
- Symbols: change the colour to green
- Classify: check yes, then select Natural Breaks.
- Classes: 5
- Round Classes: 10
- Transparency: Adjust as you want
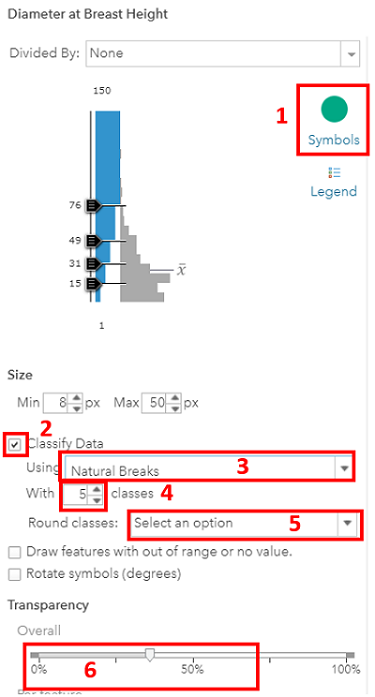
- Select OK and then Done. Don’t forget to save. Your workspace should look something like:
5. Create another new map on depicting inspection status by joining external data to your feature service.
- Using the instructions from the previous step create a new map and add your feature service (Section 4, Steps 1-6).
- Save this map as InspectionStatusMap_yourinitials.
- To visualize our inspection status we need to do two things: Import the table and join it to our feature service.
-
Select the Add option above the Table of Contents, then Add layer from file.
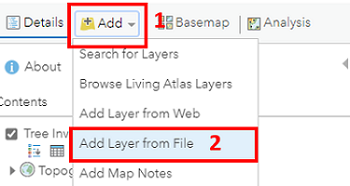
- Select the InspectionStatus.csv file from your local machine and click Import.
-
Our table does not have a locate field (lat, long etc) we just want to import it so we can join it to our Tree layer so select the None, add as table option and Add layer.
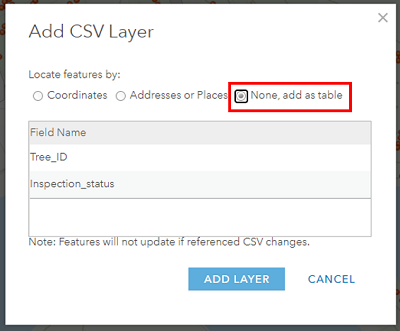
- Your table should now appear at the bottom of your Table of Contents.
- Save your changes.
-
From the Analysis options above your Table of Contents, open the heading to Summarize Data and select the Join Features option.
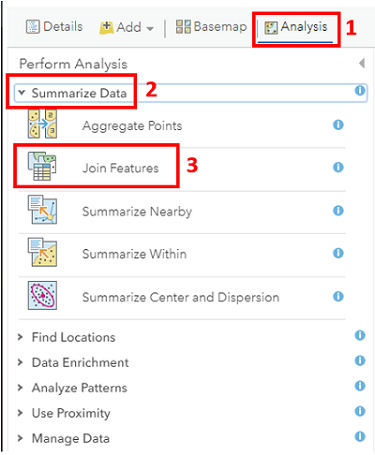
- In the Join Wizard Dialogue select the following options. Note that most options and tools have a blue circle you can hover over for more information.
- Target: TreeInventory
- Join Layer: InspectionStatus table
- Join Type: Fields in a table where TreeID = TreeID
- Operation: 1:1
- Name the file something meaningful including your initials.
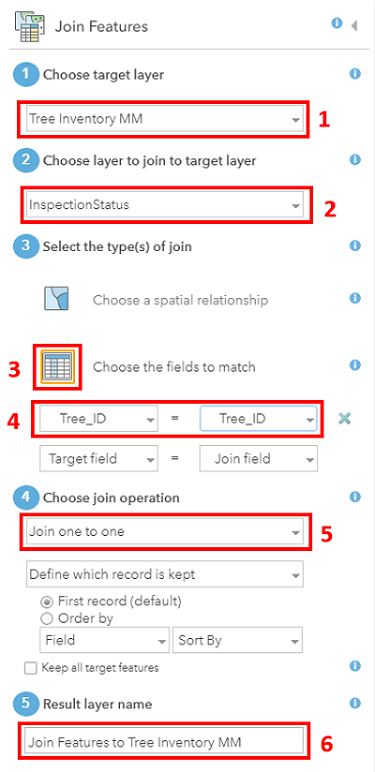
- Click the Run Analysis option, wait for the data to join and be added to the map, then save your work.
- Change the symbols for your new layer to visualize Inspection Status (open symbology options for the layer in the Table of Contents and select Inspection Status).
-
What do you think about the default colours selected?
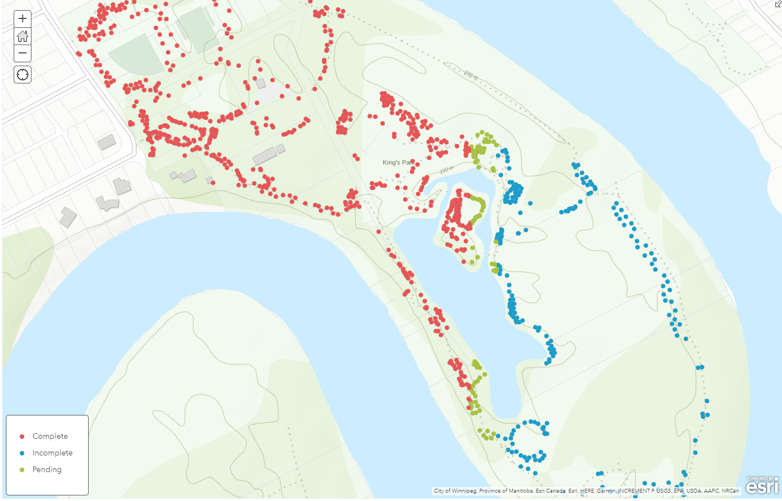
- Change the colours to something more appropriate for our message and save your work.
That’s it! We now have the building blocks to create a StoryMap in the next section!