ArcGIS Online Exercise – Census Geography and Winnipeg Schools
(Intermediate)
0. Housekeeping:
This session we will be:
- Creating a map from scratch
- Discussing census geographies
- Joining census data to spatial data
- Exploring symbology and analysis options
Exploration
1. Access your Map workspace to create your own map from scratch:
- Navigate to UM’s ArcGIS Online Portal (https://univmb.maps.arcgis.com) and ensure you are signed in.
- Access the Map area by clicking on that option in the top navigation.

2. Add data from your local machine:
We want to add some data we have downloaded to our empty map.
-
Select the Add option from the top left of your page and select the option to add the layer from a file.
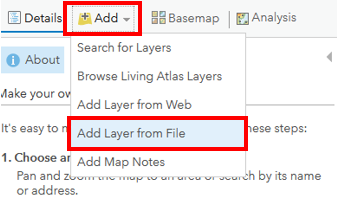
-
From the options that appear we want to Browse to the data folder you have downloaded to select to select the zipped census dissemination area shapefile (WpgDA2016).
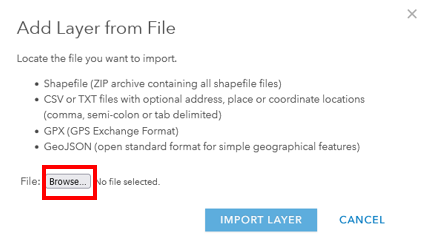
- Click Import Layer and wait for the service to be created.
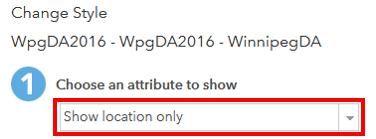
- The import wizard will want you to adjust your Symbology to display the data.
In the series of dialogue boxes that follow:-
Select the option to show location only
- Click on the Options button to change the colour or transparency of the Dissemination Areas if you wish.
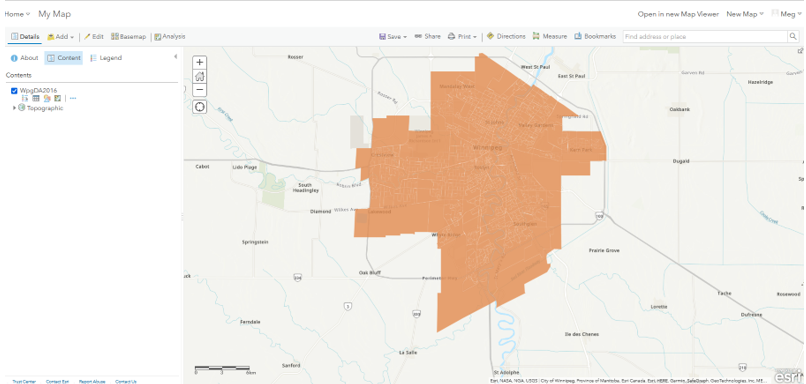
- Click the blue Done button at the bottom of your Table of Contents to finish the import.
-
- Save your new map by clicking the Save button above the workspace. Give it a meaningful name.
- Your screen should now look something like:
3a. Access your Content workspace to create your own feature service:
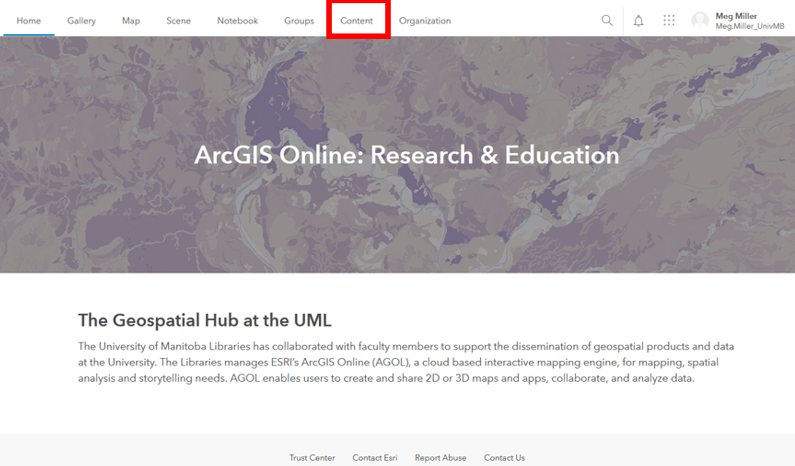
-
Access the Content area by clicking on that option in the top navigation.
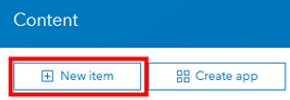
- New Item to create a feature service from a .csv file:
We want to add our tree data to our Content area in the form of a feature service so that we can publish content with it. -
Select the New Item option from the top left of your content area.
-
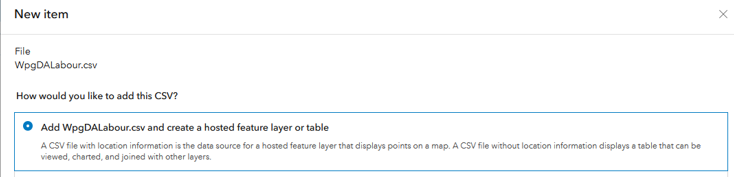
From the options that appear we want to select the From your device option to select to .csv file from your downloaded data.
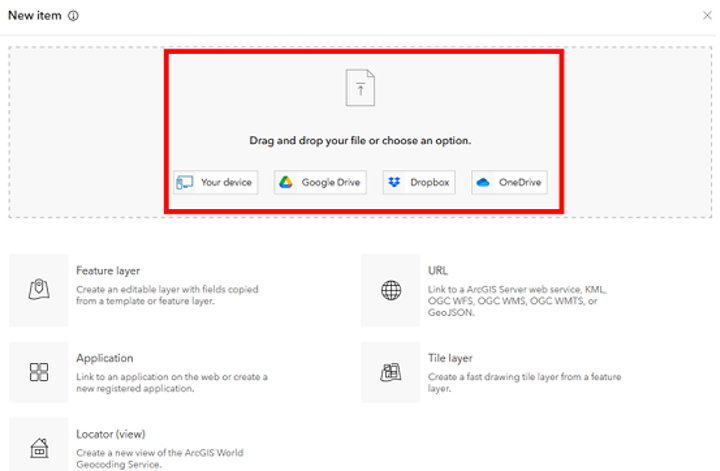
- Navigate to your WpgDALabour.csv file and add it.
In the series of dialogue boxes that follow:-
Select the optio to create a hosted feature layer from the .csv.
-
Double-check your field types and if they are not listed as double, change them in the drop-downs.
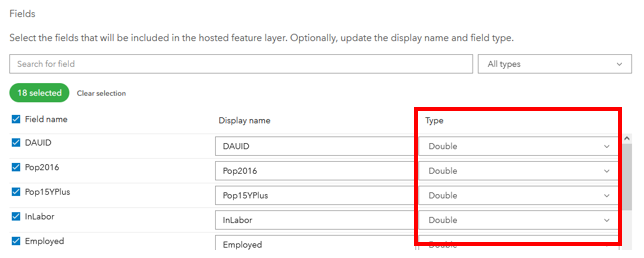
-
Ensure the location settings are listed as None.
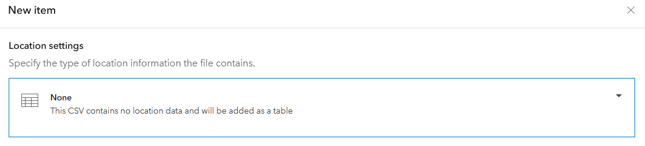
-
Title: WpgDALabour_yourInitials
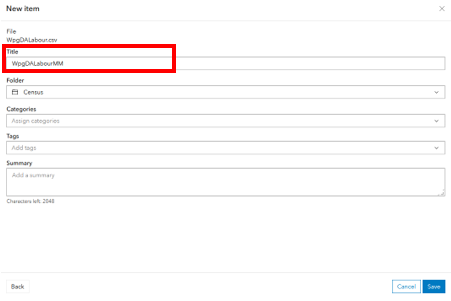
-
- Click the Save button, and wait while your service publishes.
- You should now have your own feature service to use in your map.
- Return to your personal content area.
3b. Add your table of census data to the map.
-
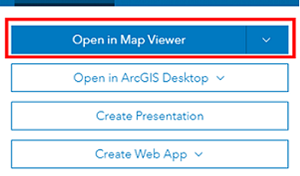
From your personal content list click the map title and select the Open in Map Viewer option on the right side of your screen.
-
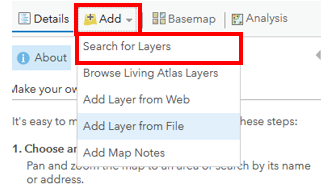
Select the Add option from the top left of your page and select the option to Search for Layers to add the table you just created in your workspace.
-
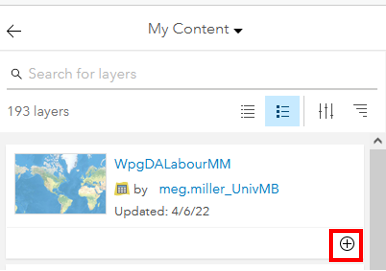
From the options that appear we want to select to the table you just created to add it to the map.
-
Return to your Table of Contents
4. Join the data from the table to the census geography file.
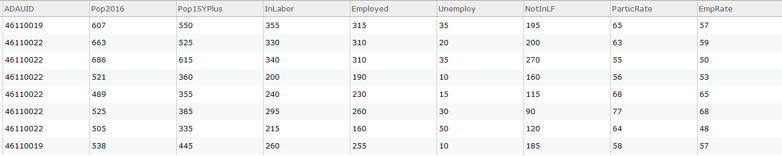
If we explore the Attribute Tables of both DA files by clicking on the  icon, we can see the disconnect between the two files.
-
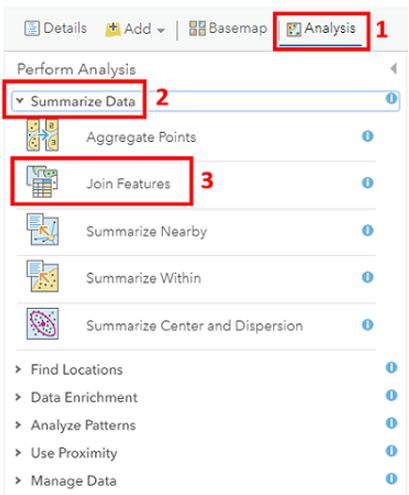
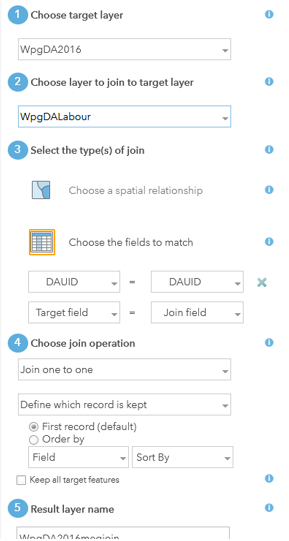
From the Analysis options above your Table of Contents, open the heading to Summarize Data and select the Join Features option.
- In the Join Wizard Dialogue select the following options. Note that most options and tools have a blue circle you can hover over for more information.
- Target: WpgDA2016
- Join Layer: WpgDALabour table
- a) Type: Choose the fields to match, b) Target: DAUID , Join: DAUID
- Operation: one to one
- Name the file something meaningful including your initials.
- Click the Run Analysis option, wait for the data to join and be added to the map
-
Check the attribute table of your newly created layer. Now you should be able to symbolize based on census information.
- Don’t forget to save your work.
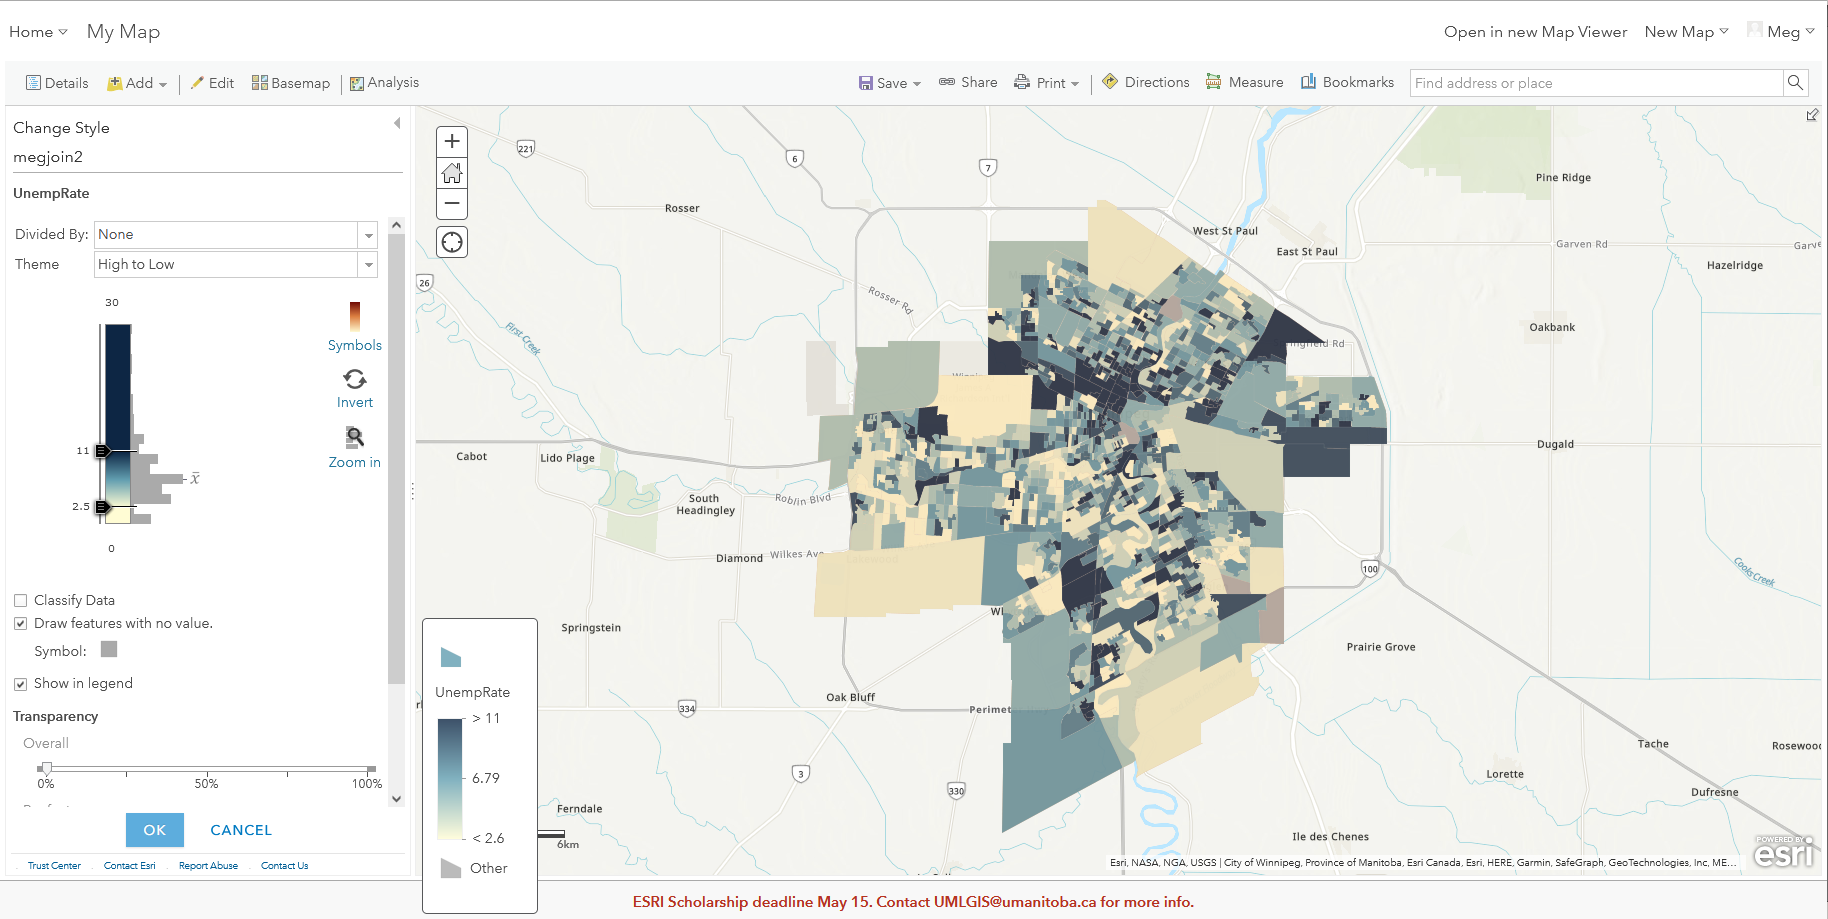
5. Symbolize map based on census attributes
You now have a layer of data with geography and census data associated with it, to bring out patterns in the data we can explore symbology options.
-
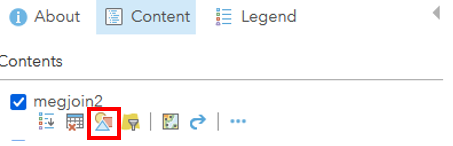
Hover over the Join layer you created in your Table of Contents. The third tile from the left (3 stacked shapes) is the option to change styles.
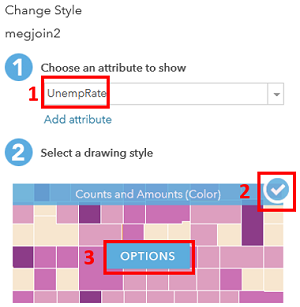
- In the Styles dialogue that opens:
- Attribute: UnempRate
- Drawing Style: Counts and Amounts (colour), then select Options.
- In the Counts and Amounts dialogue that opens:
- Symbols: change the colour.
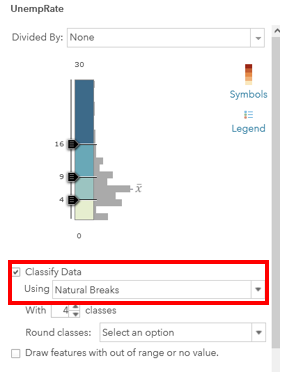
- Classify: Check off and explore classification options
- Transparency: Adjust as you want.
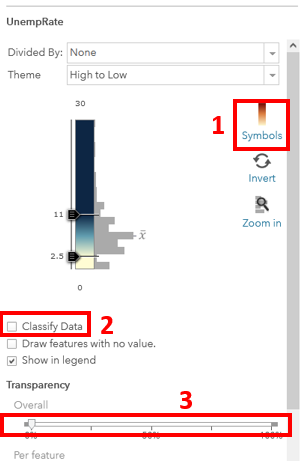
- Select OK and then Done. Don’t forget to save.
6. On your own.
- I have also shared the WpgDAPopIncome layer with you. Using the skills you have learned add it to your map.
- Symbolize based on LICO- are there any considerations you should take when doing this?
- Try adding the schools or school division boundary to the map.
- Explore the Analysis options available, do any look interesting? Try them out!
7. Share your map
There are many ways you can share your work with the world so they can explore your work.
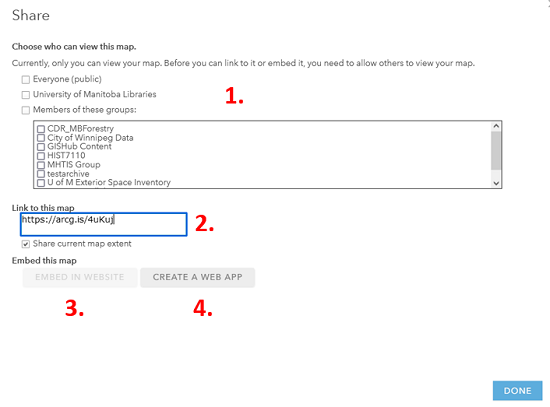
- Click the Share
 button above the map and explore the options available to you.
 - Share map with a group (1) or via link(2)
- Embed Map in a website (3)
- Create a stand-alone application (4)
Congratulations! You made it through!
Questions? Concerns?
Data: Statistics Canada, 2016