Inkscape exercise – Tips for map layout editing
Intermediate
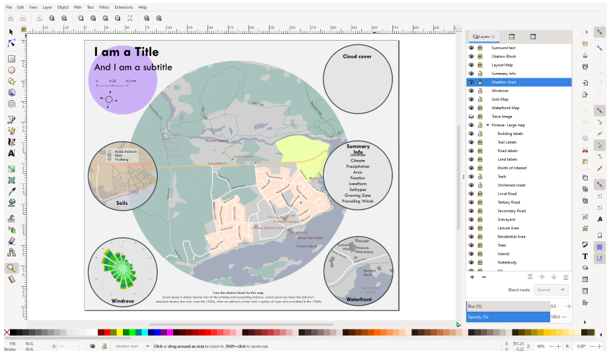
1. Open the map file
- File > Open > PinawaMap.svg
2. Explore the interface
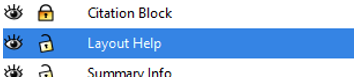
3. Delete purple guide bubble
-
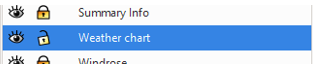
Unlock ‘Layout Help’ layer in list of layers by clicking the lock to unlock and make editable:
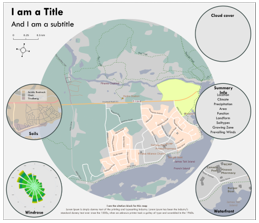
- Click once on the purple circle under the title block to select it.
- Use the delete key on your keyboard to remove the object.
Your page should now look something like:
4. Edit the Surround text
- Unlock the Surround Text layer to begin editing.
-
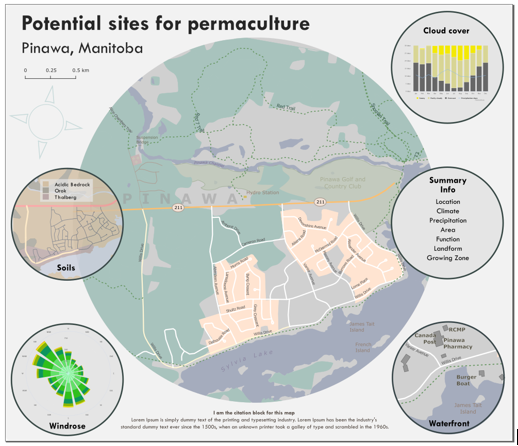
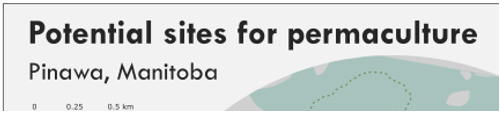
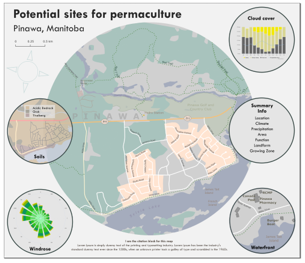
Change the Title and subtitle to something more meaningful. I chose:
Title: Potential sites for permaculture
Subtitle: Pinawa, Manitoba
Once the text is selected you can use the Text dialogue or toolbar that appears at the top of the page to change the font type, colour and size.
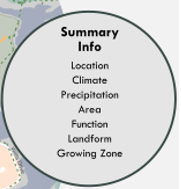
- The Summary Info bubble is looking quite crowded, we could make the font smaller, but if we step back, we can see that there is duplicated information between other bubbles and what appears here.
- Select the text you want to remove and use the delete key to remove it.
This leaves me with something like:
- Select the text you want to remove and use the delete key to remove it.
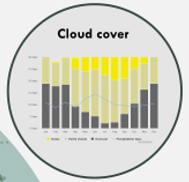
5. Import cloud cover chart
Inkscape can be unstable at times, instead of trying to import an overly complex layout from QGIS it is easier to do it in bite sized pieces. In this case, I exported all three maps separately. We are missing a cloud cover chart from the top right corner of the canvas.
-
In the layers panel ensure that the Weather Chart layer is selected and unlocked.
-
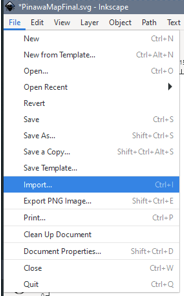
Open the File menu (top of the page) > Import > coverprecipPNG.png
- Accept defaults on the import dialogue.
- Using the corner handle
 scale the chart so it fits within the bubble.
 - Once you have things how you want them, lock the layer back up.
Your screen should look something like:
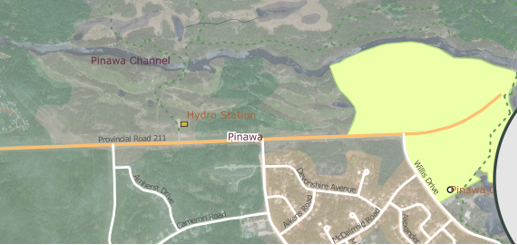
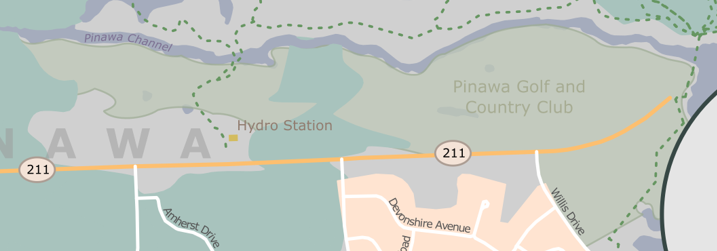
6. Use trace image to fix golf course fill
Sometimes you will need to make larger edits to your map after it has been exported from the GIS. In this case, in looking at the aerial imagery we can see that the golf course extends beyond what the government provided data gives us.
-
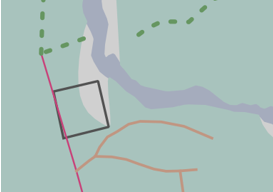
In the Layers panel drag the Trace Image layer so that it sits below the Leisure Area layer. You can now see where the Golf course fill should be.
-
Ensure the Leisure Area layer is selected in the Layers panel and use the Freehand tool
 to sketch in the missing part of the shape. Overlap it with the existing shape.
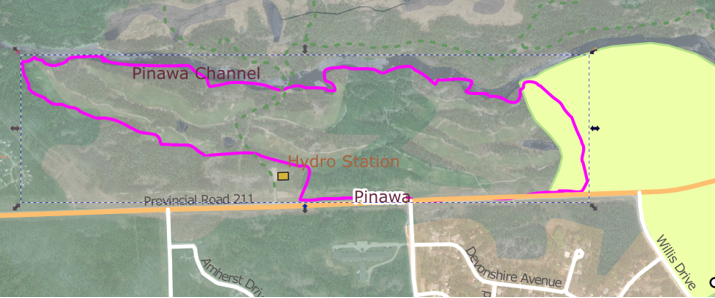
- Now we can use the union action to combine with the existing leisure polygon. Shift click to select both shapes.
- Select the Path menu (top of screen) > Union
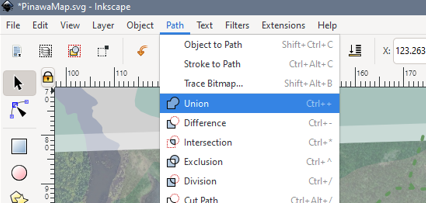
For the union to properly work, everything needs to be in the same layer, and completely ungrouped (this is where a deep ungroup can come in handy).
After reordering the layers, and applying a less aggressive fill, my golf course looks like:
7. Use Symbols for cemetery
There is a small cemetery in the top left corner of the map. We could label it, but it isn’t that important in out theme, so we can just symbolize it a little differently. In this case with a cross symbol, and fill that blends into the base a bit better.
- Find the Graveyard layer in the Layers panel and ensure it is unlocked and selected.
- Select the Graveyard polygon and assign it a light brown fill.
-
Click Objects Menu (top of page) > Symbols > United States National Park Symbols > first aid
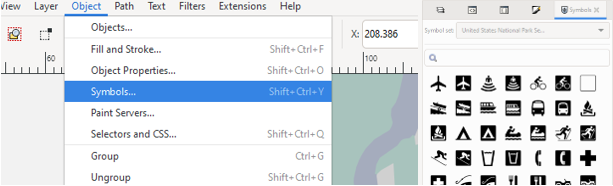
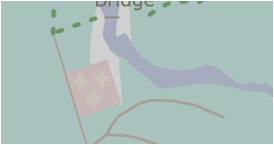
- Drag the symbol onto the map and resize/ recolour/ duplicate it to create a fill.
Mine looks something like:
8. Continue making edits to the map using the actions we covered in today’s session.
I have provided you with a file of a potential ‘final’ you can look at for inspiration, or you can go your own way.
9. Export as .png
Once your map is how you want it, you will need to export as an image so it can be used in other applications.
- File > Export PNG Image
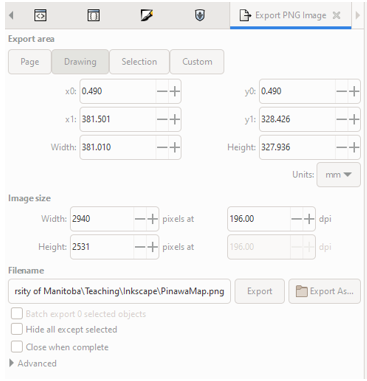
(A rule of thumb, 300DPI resolution for print, 150DPI for web)
Congratulations! You made it through!
Questions? Concerns?
Data: OpenStreetMap, Manitoba Land Inventory, Meteoblue Climate