ArcGIS Online Exercise – Pretend you’re a dishonest schoolboard trustee…
(Basic)
0. Housekeeping:
Today we will be exploring the ArcGIS Online interface by:
- Finding data available data
- Integrating files
- Adjusting dataset parameters
- Discussing export options
Exploration
1. Access your workspace:
- Navigate to UM’s ArcGIS Online Portal https://univmb.maps.arcgis.com
- Log-in by entering your UM email and password.
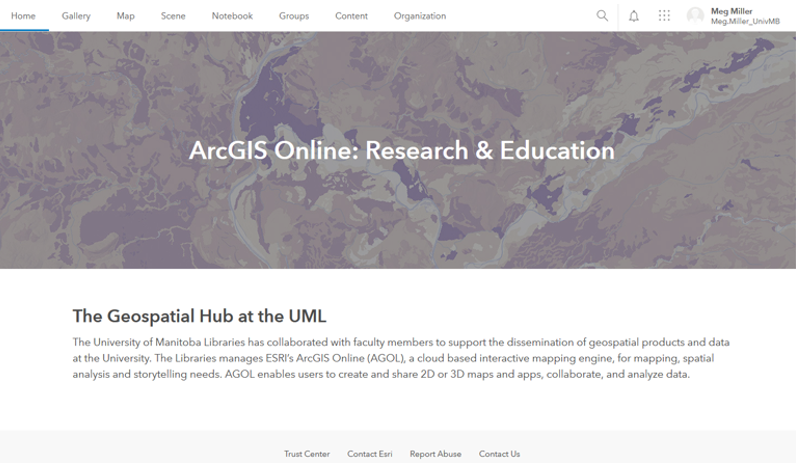
- The Home page is your Landing Page.
2. Explore AGOL Interface:
Numbers 1-3 illustrate the locations of the following elements:
- Account (includes link to training materials)
- Tools (all of the different ESRI Apps available to you)
- Options (pages for different purposes (your content, maps, etc.)

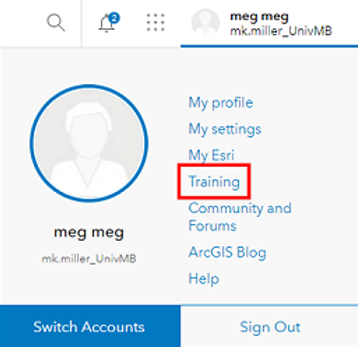
3. Explore Training options:
- Click on your username in the top right corner of the screen.
-
Select the Training option half way down the list.
- At the top of the page select the Catalog option, then the Course Catalog
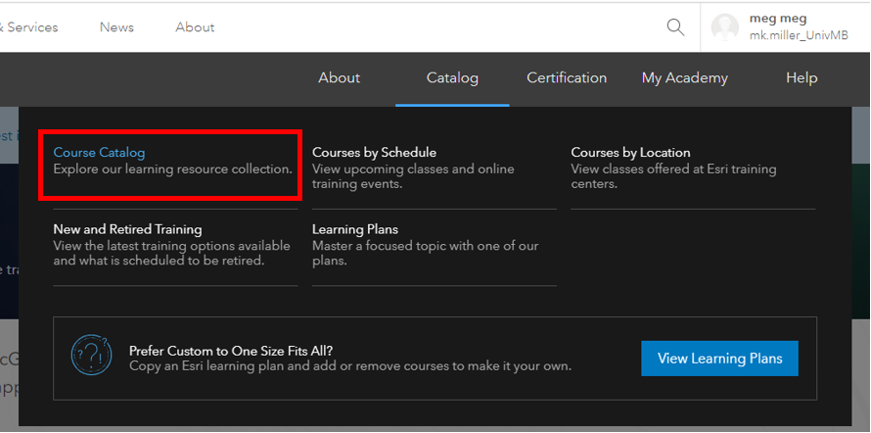
- Take a bit of time to browse through the training options available to you.
- Return to the UM AGOL Home page.
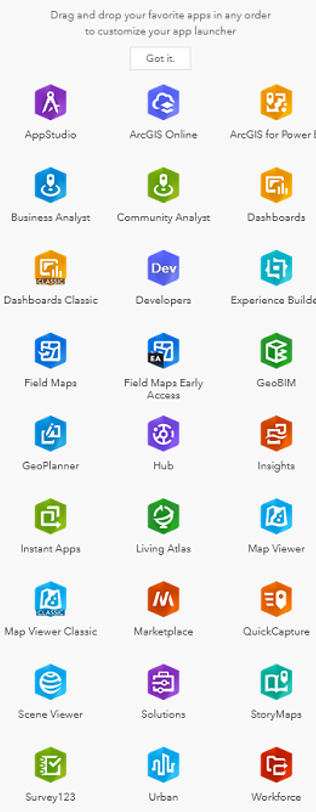
4. Explore available tools:
- Click on the waffle button that is to the left of your username in the top right of the screen to see the tools that are available.
- Today’s session will be focusing on ArcGIS Online (also linked in the top navigation of your Home page).
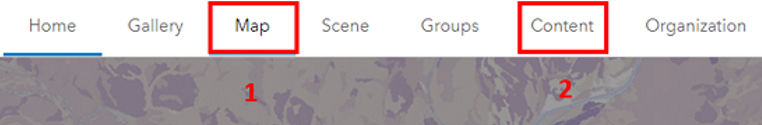
5. Explore AGOL Home options:
Numbers 1-2 illustrate the most useful navigation options of the Landing Page:
- Map (where to go to create a new map in AGOL)
- Content (where all of your data, objects and organizational content is stored)
Creation
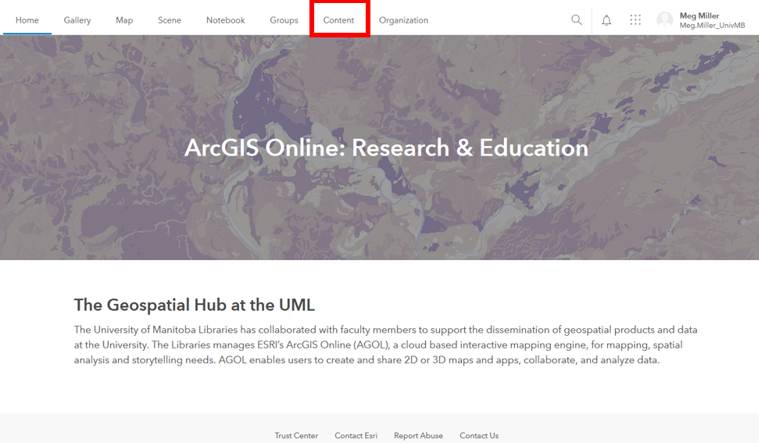
1. Access your Content workspace:
- Access the Content area by clicking on that option in the top navigation.
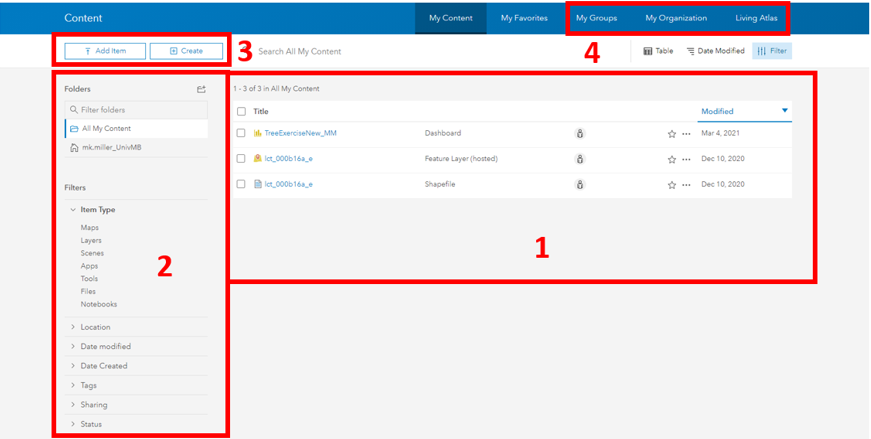
2. Explore the Content Panel:
Numbers 1-4 illustrate the locations of the following elements:
- Personal content (includes all data and objects you have created)
- Filters (allows you to easily limit the things that show up in your content area)
- Create New (one of many ways to create/ add content to your workspace)
- Available content (items that have been shared to you through groups, University of Manitoba or ESRI’s Living Atlas.)
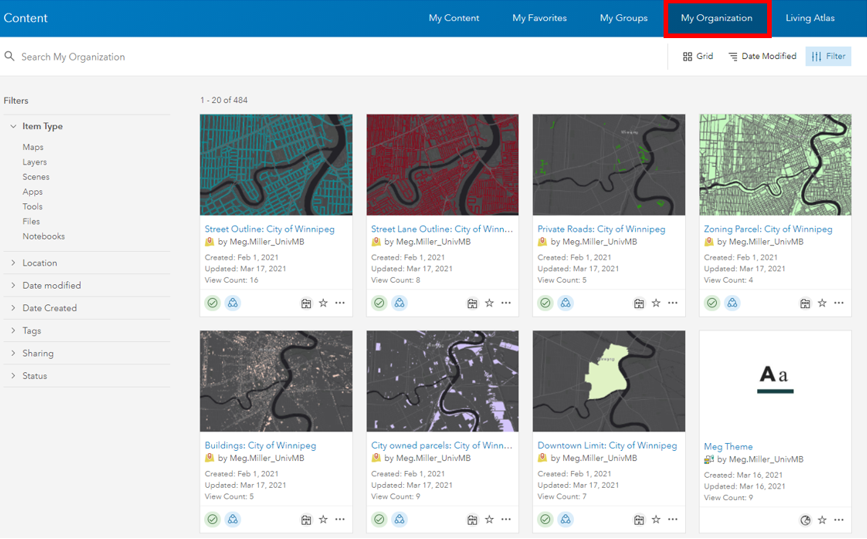
3. View Organization data options:
-
Click on My Organization in the blue Content navigation bar. This brings up data that has been shared at the Organizational level. Be aware, not all of it is available for reuse.
-
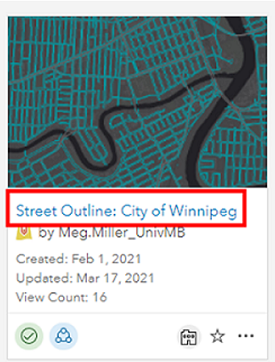
Search for Street Outline: City of Winnipeg. Click on the title to see more details about the file.
-
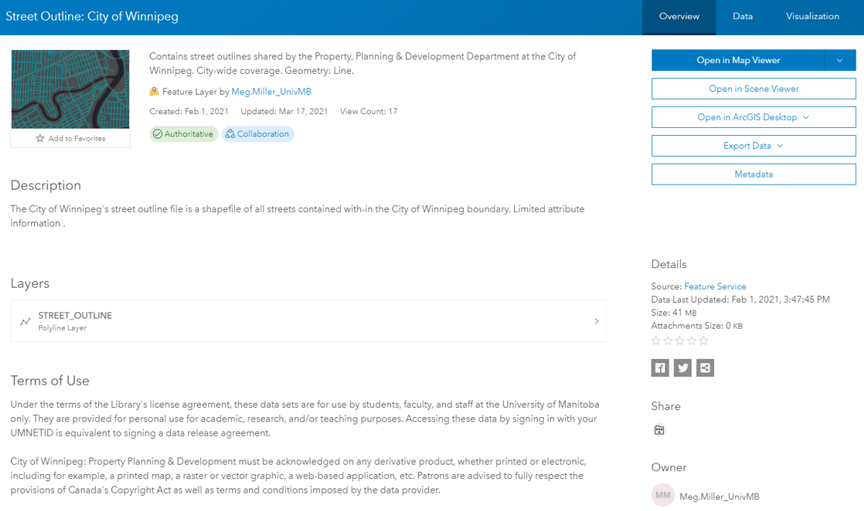
Now we can see a Description and the Terms of Use for the file, as well as options to explore the data further.
-
Return to your personal content page.
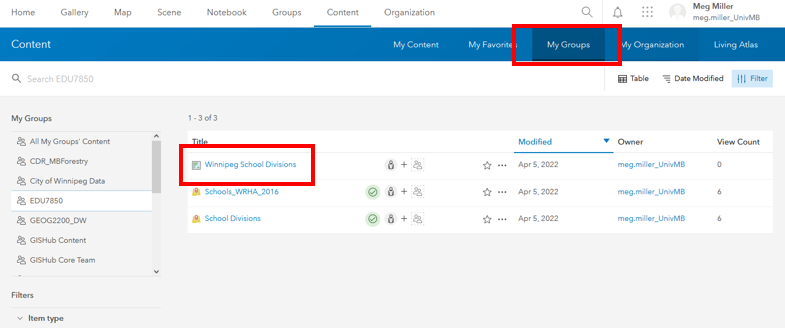
4.1 View Group data options:
- Click on My Groups in the blue Content navigation bar.
- This brings up items that have been shared at the Group level, I have shared one (1) map and two (2) feature layers with you.
-
Click on the Winnipeg School Map map that has been shared with you.
-
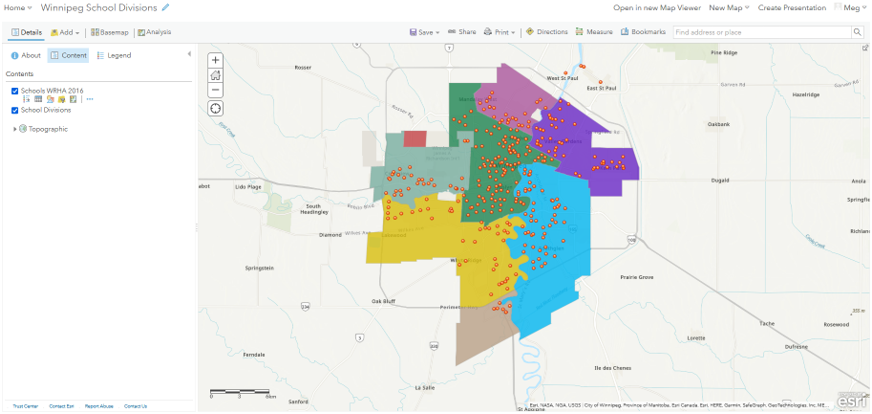
Click on the Open in Map Viewer option.
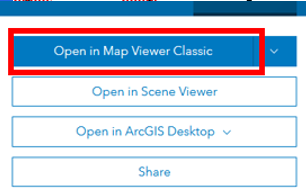
-
Your screen should now look something like:
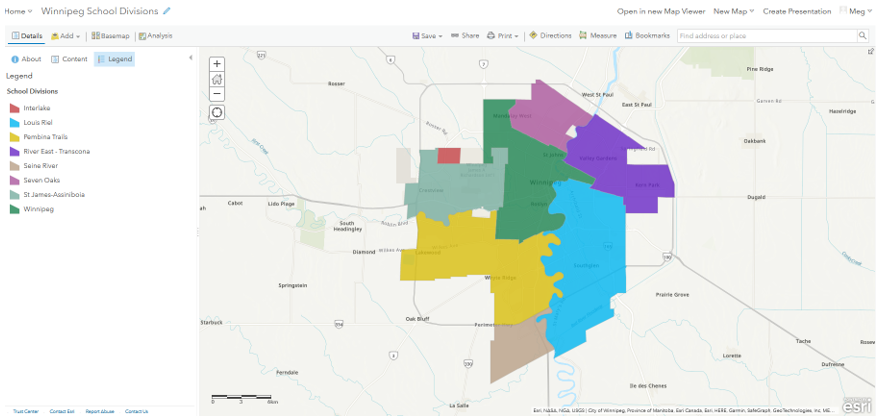
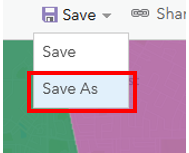
- Save your map by clicking the Save As option above the map and adding your initials to the end of the name. Your map is now saved to your personal content area.
4.2 Add data that has been shared with you through a Group:
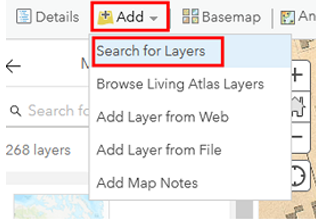
-
Click on the Add data option above your map. Select the Search for layers option.
-
Ensure the My Groups option is selected from the dropdown
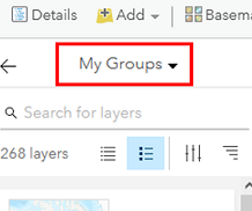
- This brings up items that have been shared at the Group level, I have shared two feature layer with you.
- Click on the WinnipegSchools layer that has been shared with you.
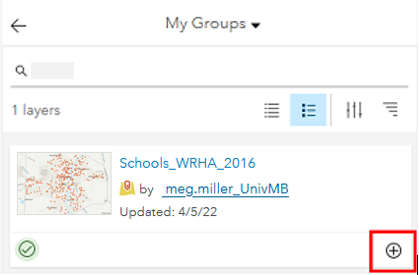
-
Add item to map using the plus sign in the bottom right corner of the item. Your map should now look something like:
-
Save your work.
5. Explore the workspace.
Numbers 1-4 illustrate the locations of the following elements:
- Tool options
- Actions (allows add new content to the map, change your base map, conduct simple analyses)
- Table of Contents (properties options for individual layers such as: attributes, symbology and pop-up configuration)
- Your map workspace
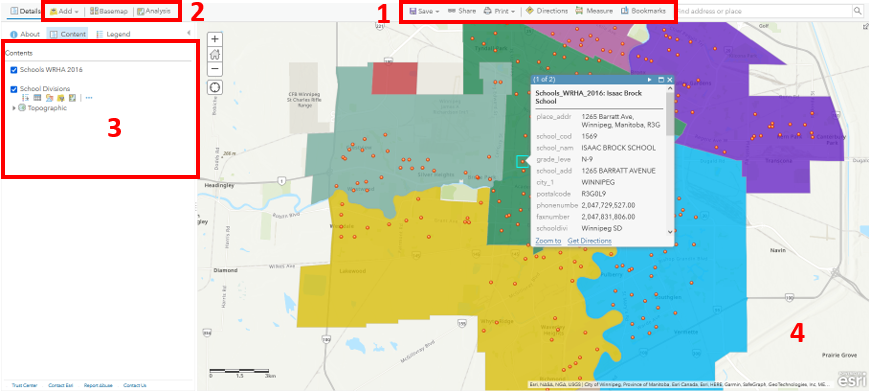
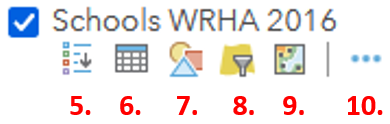
Numbers 5-12 illustrate the purpose of the icons found in the Table of Contents:
- 5 - Legend
- 6 - Attribute table (information about each data point displayed as a table)
- 7 - Symbology (change the appearance of feature)
- 8 - Filter (show a subset of your data)
- 9 - Perform analysis (analyze this specific layer)
- 10 More options (zoom, transparency, pop-ups, labels…)
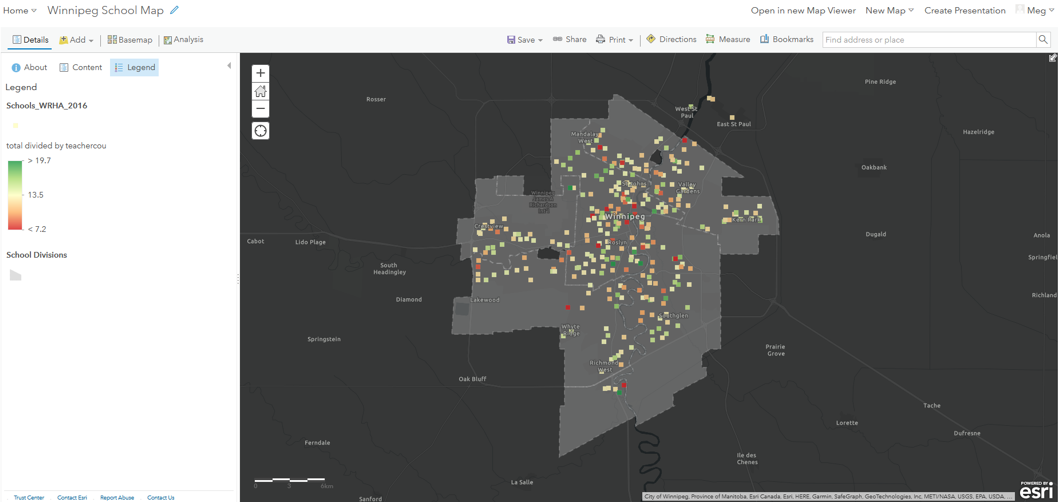
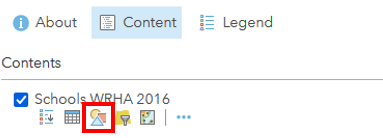
6. Change symbology styles to reveal staffing patterns in the schools data
-
Ensure you are in the Content area of your Table of Contents to change symbology. The third tile from the left (3 stacked shapes) is the option to change styles.
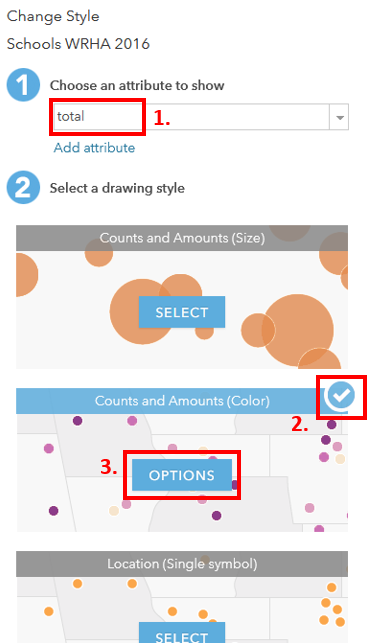
- In the Styles dialogue that opens:
- Attribute: Total
- Drawing Style: Counts and Amounts (colour), then select Options.
- In the Counts and Amounts dialogue that opens:
- Divided by: Teachercou.
- Theme: Above and Below.
- Symbols: click ramp to change the colour.
- Classify: No need to check off, we just want to see the data points relative to one another.
- Transparency: Adjust as you want.
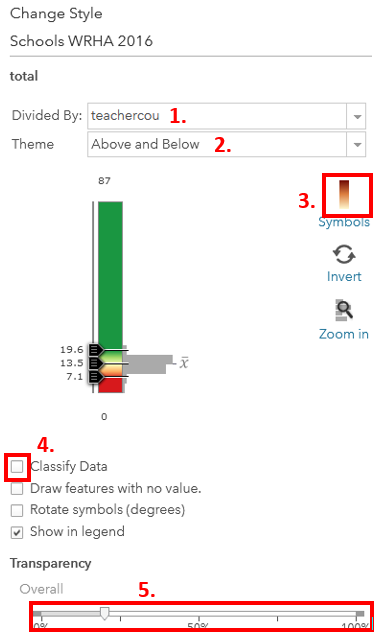
-
Select OK and then Done. Don’t forget to save. Your workspace should look something like:
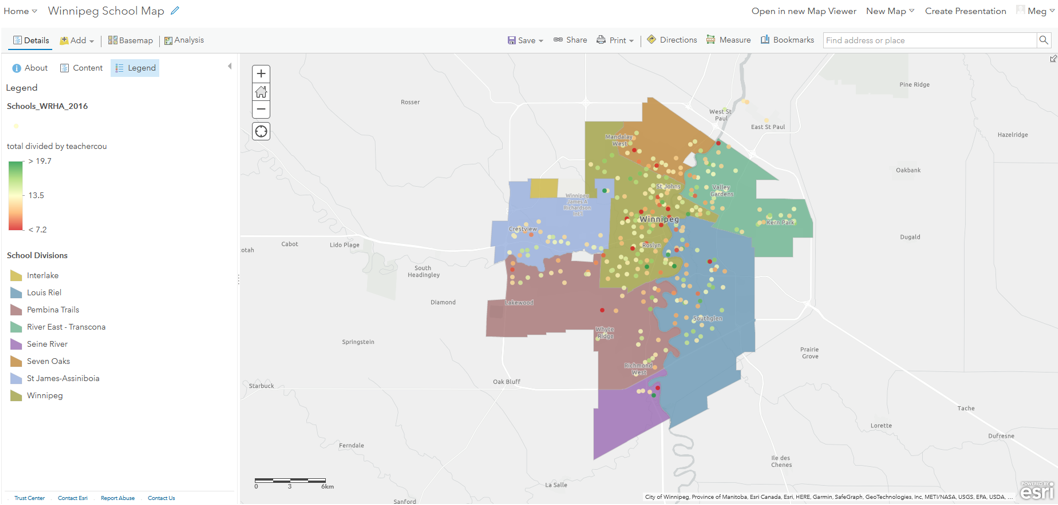
- Try changing the symbology:
- School division layer so it is less aggressive
- Can you figure out how to change the basemap?
Congratulations! You made it through!
Questions? Concerns?
Data: Winnipeg School Divisions , Winnipeg Schools