Sharing your story as a whole using StoryMaps
0. Step Back:
While we have had the purpose of creating a StoryMap in the back of our minds while we were creating our maps, let’s step back take stock of what we have, and make a concrete plan.
Our Scenario:
You have been hired as the GIS intern with the Campus Planning Department at UM. The arborists have been doing a lot of work on campus and entering information into their new tree inventory system. Your job is to create a story map for the campus community to help them appreciate the campus trees.
What do we have?
- Map of Trees by Genus
- Heat Map of Tree Distribution
- Map of trees by Trunk or Crown Diameter
- Summary statistics about campus trees
- Workshop folder that includes: images of trees and other elements, a locator map, some text to copy and paste, data urls.
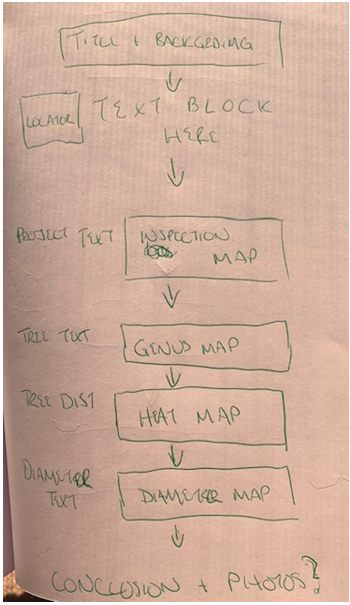
Map out your idea:
1. Access the StoryMap:
- Navigate or use the waffle button on your Home screen to get to the StoryMaps landing page (https://storymaps.arcgis.com/stories) and ensure you are signed in.
- The landing page has the same elements as ArcGIS Online, but organized in a different way.
Numbers 1-4 describe them.- Account settings
- Create a new story
- List of personal/ available content
- Training materials
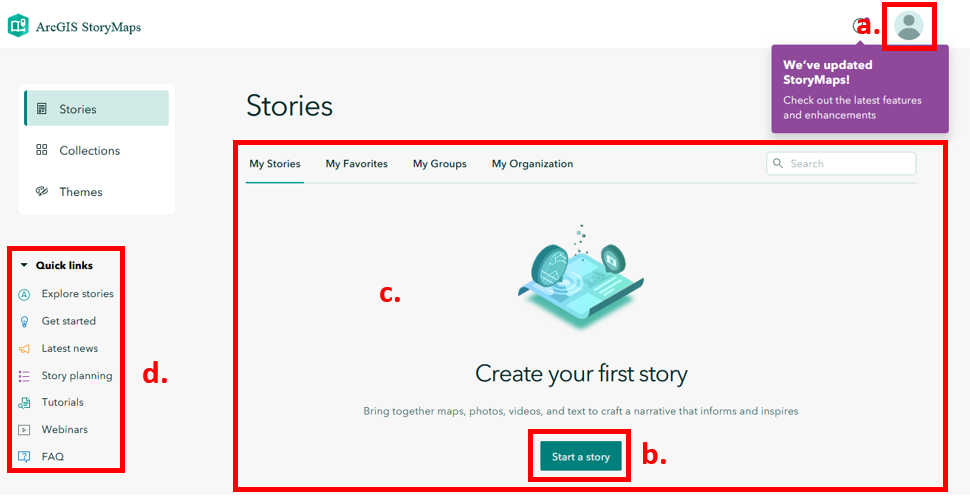
- Select the New Story button to start a new story from scratch. Your Story will save automatically as you work.
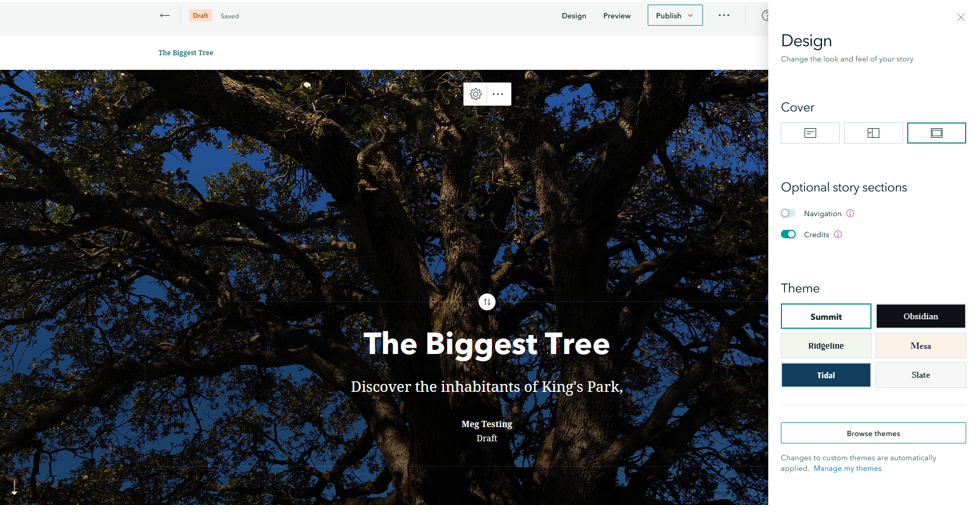
- Your screen should look something like:
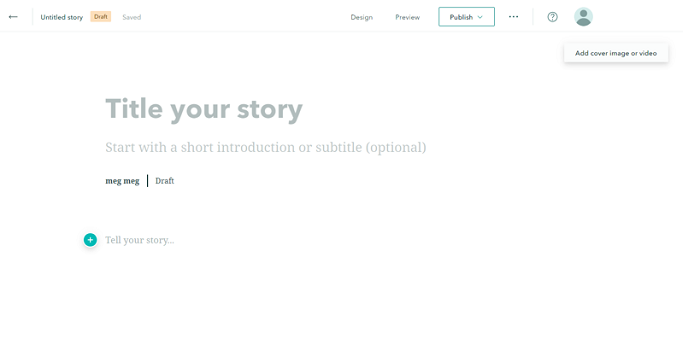
2. Explore the StoryMap workspace.
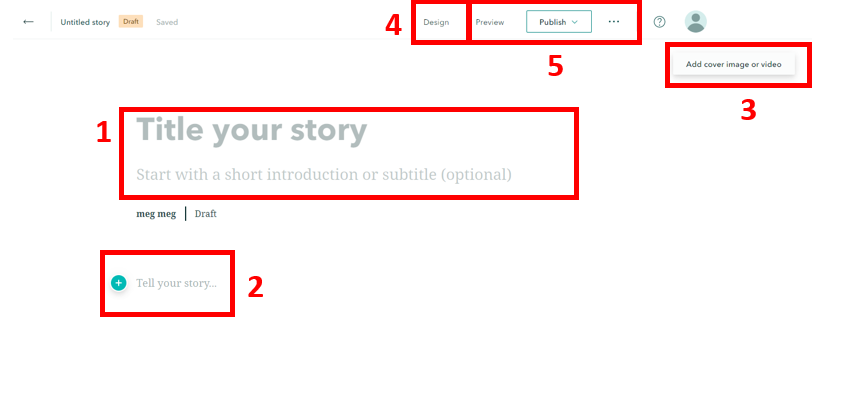
- Numbers 1-5 describe the different elements available:
- Add a title and subtitle by typing directly into the browser.
- Add a new object/row to your story.
- Add media to the row.
- Adjust the design of your story by selecting a pre-set (colour/font/layout) or create a template of your own.
- Sharing options to Preview and Publish your story.
- On your own:
- Add one of the images provided to you in the workshop data as a cover image
- Adjust the Design to see how the look of your workspace changes.
- Add a creative title/subtitle to catch the attention of your audience.
-
I selected to use a Full cover and the Summit theme for simplicity.
- This is where I would usually step back and assess the font and colour choices of my theme in relation to the project:
- Is the colour of the theme cohesive with my background image?
- Is personality of the font appropriate for my audience and purpose?
- How much time do I have? Is one of the default templates good enough, or should I create a custom theme?
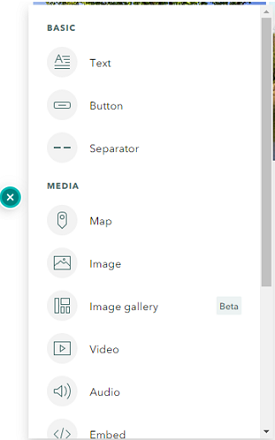
3. Add a new object to your StoryMap.
- Hover your mouse below your cover page block, a green plus sign will appear.
-
Clicking on the plus sign reveals all the different objects that can be added to your page.
- In the plan I made, I said I was going to add a text box with a locator map to the left (you can always reorder the rows later).
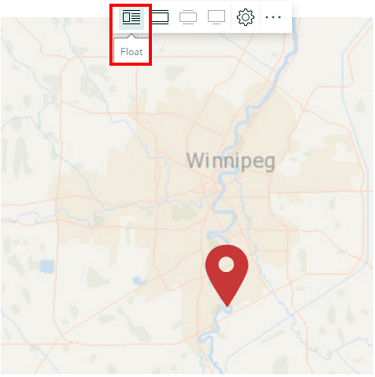
- Select the Image option and upload the locator map image from the workshop content that was made available to you.
- Once the image is loaded you will see the image options by hovering over its top.
-
I am going to select the float option so that I can add text next to it.
-
Next I will add my Text by clicking the green plus sign that appears on the top right corner of my newly added image. Hovering over each element provides a description.
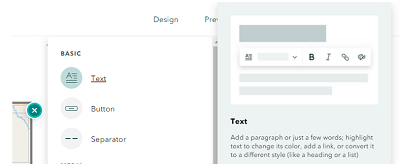
- Copy and paste the text from the word document provided in the workshop content. You can see that you can format text as headers, lists and add hyperlinks.
- Step back and assess. In my case, my block looks like:
4. Add an immersive object to your StoryMap.
When we scroll to the bottom of the list of objects we can add to our page there are 3 immersive options: slideshow, sidecar and map tour. As all the maps we have created are of the same area and scale, vertical sidecar scrolling will be a good fit.
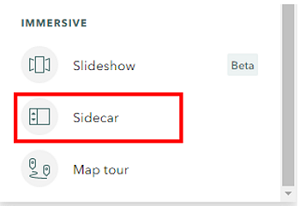
- Add a sidecar row to your page by clicking the green plus sign below the row you just added and selecting the sidecar option.
- Select whichever layout you prefer, and then click Done, your new sidecar wizard will open.
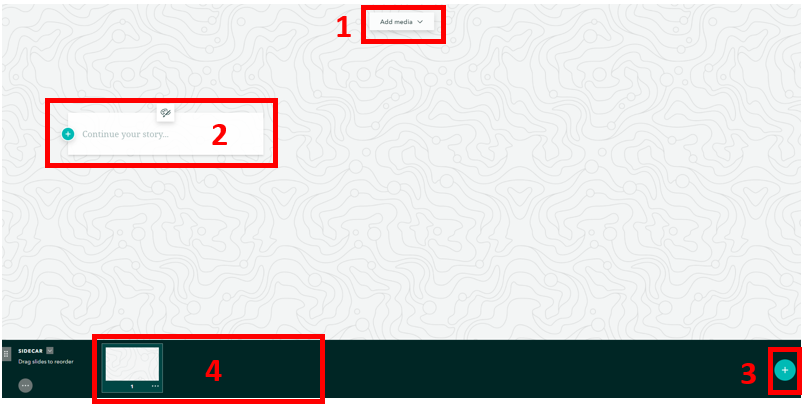
- Explore the sidecar builder. Numbers 1-4 describe the different elements:
- Add media: where you add the background image/map
- Add text: where you add your descriptive text, you can also add images, other maps, videos etc.
- Add slide: where you add a new object inside the immersive viewer.
- Your slides: the content that is already loaded into the viewer.
5. Add a map to your sidecar.
- Click the Add media button at the top of the window (1) and then select the map option.
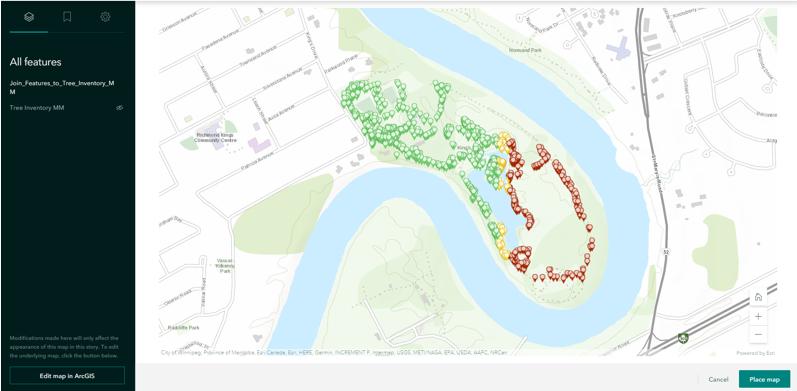
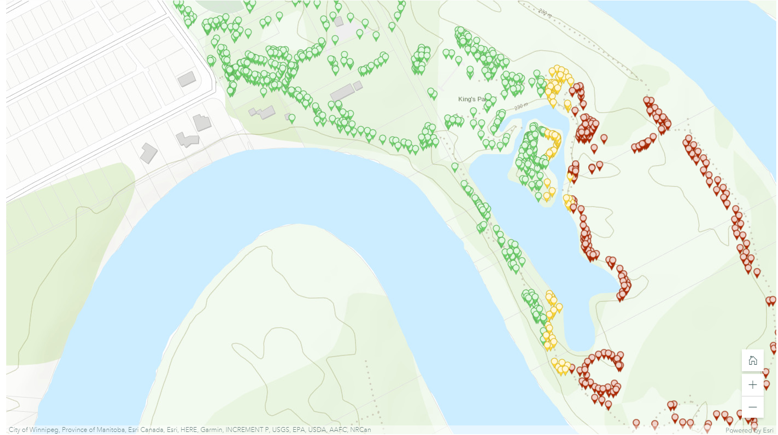
- Your available ArcGIS Online maps appear as options to select. I am going to add a tree map.
-
After adding my map, the dialogue changes to a map preview:
-
I know that I will have a text box floating on the left side of my page, so I will pan and zoom my map to position it something like:
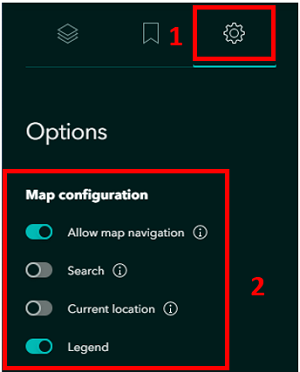
- Select the gear option at the top of your map to display map properties, here you can control how the user interacts with your map.
-
In my case I want to allow for map navigation (scrolling and panning) and also show the legend, so I have toggled these options on.
- Click Place Map in the bottom right corner of your screen to finish adding your map.
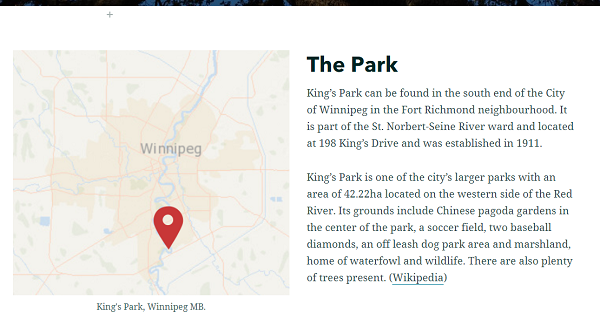
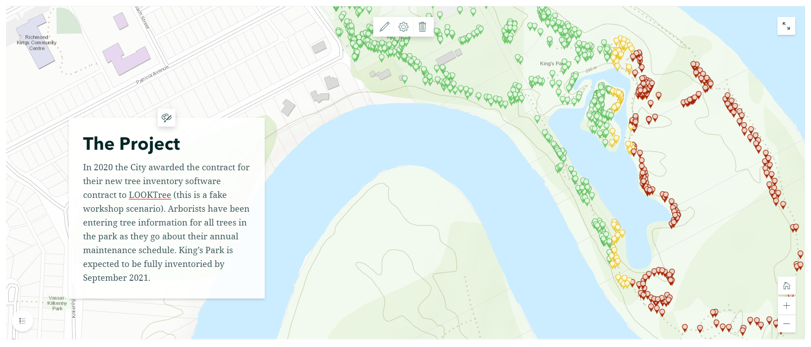
- I will also add context text to the textbox by clicking the green plus sign and selecting the text option. I am copy + pasting the The Project text from the workshop text document.
-
Slide 1 of my sidecar now looks something like:
- Continue to populate your sidecar with the other maps you have created. There is a link to a video, and some other images that you can try adding to your sidecar/ text boxes as well.
- Play around with other adding other elements to your StoryMap, feel free to go beyond the content/text I have provided you in the workshop folder.
6. Publish and share
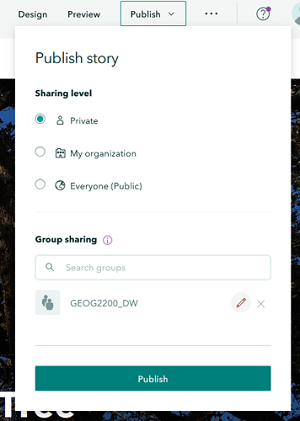
Once you have finished adding content and are happy with your results, you can select the Publish option at the top of your screen. The builder will prompt you if any components of your StoryMap do not have the appropriate sharing settings to be displayed properly.
- Ensure all elements are shared with the GEOG2200 group.
Note It is up to you to know the permissions level on the data/ media you have embedded in your StoryMap and not break copyright.
Congratulations! You made it through!
ASSIGNMENT:
Now that you have completed the walk-through using Campus data, apply the concepts you have learned to the Kildonan Park dataset found in the shared ArcGIS Online folder, then create a StoryMap using the Kildonan Park maps created.
MAPS:
- A map that categorizes the data by botanical name, format the pop-ups for clarity;
- A map that symbolizes trees by diameter of trunk (either using colour or proportional symbology);
- A heat map that depicts the concentration of trees in the park;
- A map on a theme of your choice that incorporates another data layer you have downloaded from the City of Winnipeg’s open data portal or the Library’s GIS Hub.
STORYMAP:
Your StoryMap should include:
- Title;
- Descriptive text for each map and piece of media;
- Your four maps;
- Media (Created by visiting the Park or searching on the internet)
- One embedded video
- At least one embedded image
- Summary statistics to support your story.
- References for the data, images and video if necessary.
SUBMITTING
Update metadata and ensure you have properly shared to submit your file to Dr. Walker for grading.
- Navigate to the content area of your workspace.
-
Select your StoryMap to open up the item description page.
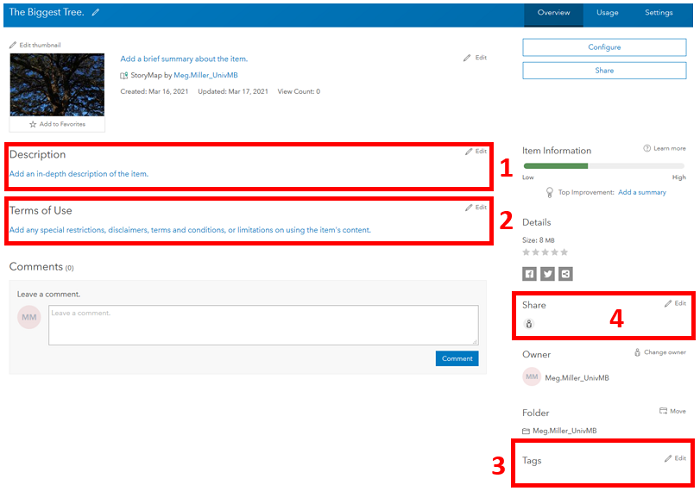
- Update the previously highlighted sections as follows:
- Description: Describe your project
- Terms of Use: Let people know this is a student project for the GEOG 2200 course
- Tags: GEOG2200_2026
- Share: Under group sharing ensure the GEOG2200 group is selected
Questions? Concerns?