PowerBI
A gentle introduction to dashboards
Meg Miller - GIS & Data Visualization Librarian
workshop: bit.ly/uml_pbi
Objectives
- Gain an overview of data dashboards and popular visualization strategies;
- Become familiar with popular visualization software and what is supported through the University;
- Explore PowerBI interface.
Outline
- Define key terms;
- Discuss visualization types and their uses;
- Evaluate available dashboard software;
- PowerBI Exercise:
- Explore PowerBI interface
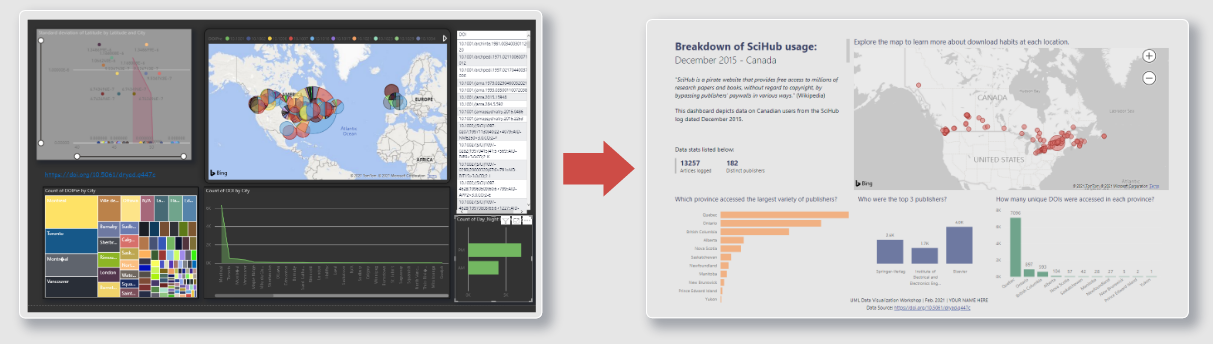
- Load and symbolize SciHub data
Key Terms:
- Data Visualization: Display complex information in a way that makes it easier for your end user to explore or understand what you have done.
- Data Dashboard: A graphical user interface providing easily digestible views of a particular process or objective.
Getting Started:
Data Visualization LibGuide
Don't forget about training resources!
Dashboard Considerations:
- Your expertise - be kind to your future self;
- Purpose - exploratory vs. explanatory;
- Audience - expertise, mediation;
- Data requirements - size, residency, privacy...
Today's Session:
PowerBI Exercise – Building a better dashboard
Questions
meg.miller@umanitoba.ca
workshop: bit.ly/uml_pbi