ArcGIS Spatial Analytics:
Insights & Dashboards
Meg Miller - GIS & Data Visualization Librarian
workshop: bit.ly/spa_w2021
Objectives
- Gain an overview of dashboards and popular visualization tools;
- Explore ArcGIS interface;
- Load and symbolize tabular data to an existing project.
Outline
- Define key terms;
- Evaluate visualization tools and their uses;
- Discuss main use cases for ArcGIS Insights vs. Dashboards;
- ArcGIS Dashboard Exercise:
- Explore platform interface
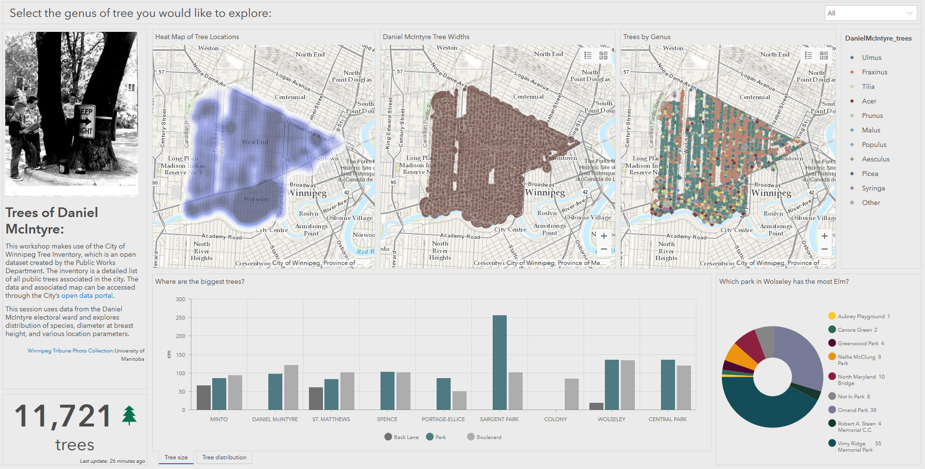
- Update simple dashboard of Winnipeg tree data
Key Terms:
- Spatial Analytics: Statistical analysis of geographic data.
- Dashboard: A graphical user interface providing easily digestible views of a particular process or objective.
Getting Started:
Data Visualization LibGuide
Don't forget about training resources!
Upcoming Fall/ Winter Sessions
October 28:Intro. to Data Visualization - SciencesNovember 18th:Accessing Geospatial Data for Winnipeg & ManitobaDecember 2nd:Open Data: Manitoba Crop InventoryJanuary 20th:QGIS 1: A Gentle Introduction to Open Source GIS SoftwareFeburary 10th:PowerBI 1: A Gentle Introduction to Data DashboardsFeburary 24th:Infographics: An IntroductionMarch 10th:ArcGIS Spatial Analytics: Insights & Dashboards- March 24th: Data Visualization: the Good, the Bad and the Ugly
Which tool is right for my data?
| Tabular | Geospatial | |
|---|---|---|
| Web Based: | PowerBI, Tableau | ESRI Insights or Dashboards |
| Desktop | SPSS, SAS, PowerBI/ Tableau Desktop | ESRI ArcGIS, QGIS, GRASS |
Which tool is right for my data? (Pt. 2)
| Insights | Dashboards | |
|---|---|---|
| Are you looking to conduct analyses? | Yes, in depth! | Yes, simple descriptive stats. |
| What is your study timeframe? | What might happen in the future. | Events happening now. |
| What sort of questions are you asking? | ‘How’ & ‘Why’ | ‘What’ |
Dashboard Considerations:
Message - be selective
Audience
Data - requirements and structure
Data Exploration with ESRI Operations Dashboard
Questions
meg.miller@umanitoba.ca
workshop: bit.ly/spa_w2021