A gentle introduction:
Open-source GIS
Meg Miller - GIS & Data Visualization Librarian
workshop: bit.ly/qgis_w2022
Objectives
- Gain an overview of GIS and popular visualization strategies;
- Become familiar with popular GIS software and what is supported through the University;
- Explore QGIS interface.
Outline
- Define GIS;
- Discuss data types and their uses;
- Evaluate available open software programs (strengths/ weaknesses);
- QGIS Exercise:
- Explore QGIS interface
- Load and symbolize COVID data
What is GIS?
Geographic Information System
Any system used to analyze, capture or work with geospatial data.
Data Types?
- Tabular/textual
- Vector
- Raster
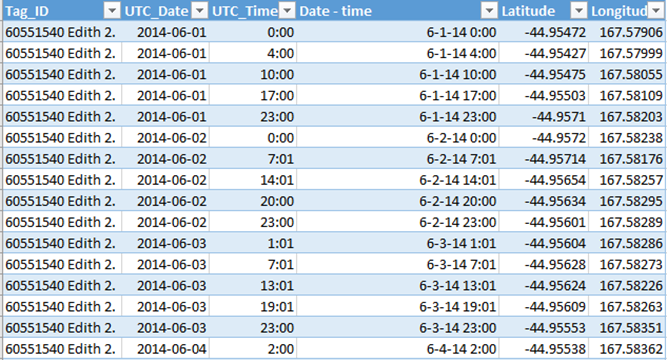
Data Types: Tabular
Data Types: Vector (point, line, polygon)

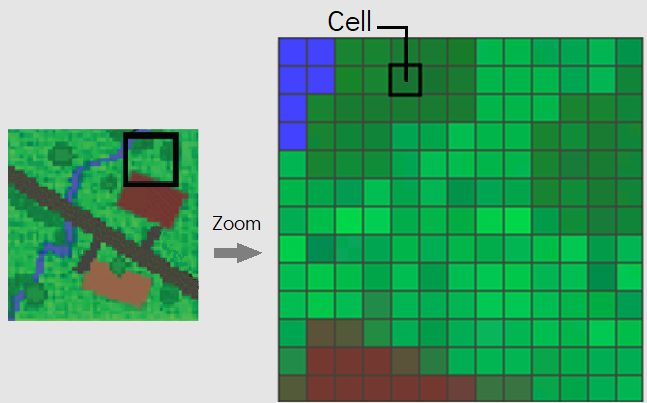
Data Types: Raster
Software Access:
Data Visualization LibGuide
Don't forget about training resources!
Upcoming Fall/ Winter Sessions
January 19th:Open Data: Manitoba Crop InventoryFebruary 16th:Introduction to data cleaning with OpenRefine & word clouds- February 23rd: QGIS 1: A Gentle Introduction to Open Source GIS Software
- March 2nd: Infographics: An Introduction
- March 9th: PowerBI 1: A Gentle Introduction to Data Dashboards
- March 16th: Data Visualization: the Good, the Bad and the Ugly
- April 6th: Network Visualization using VosViewer - An Introduction
(Wednesdays at noon)
Open GIS Software:
- Visualize + Contextualize: Google Earth
- Perform Analysis: QGIS
- Visualize & Share: Leaflet, mapbox.js, Carto...
Today's Session:
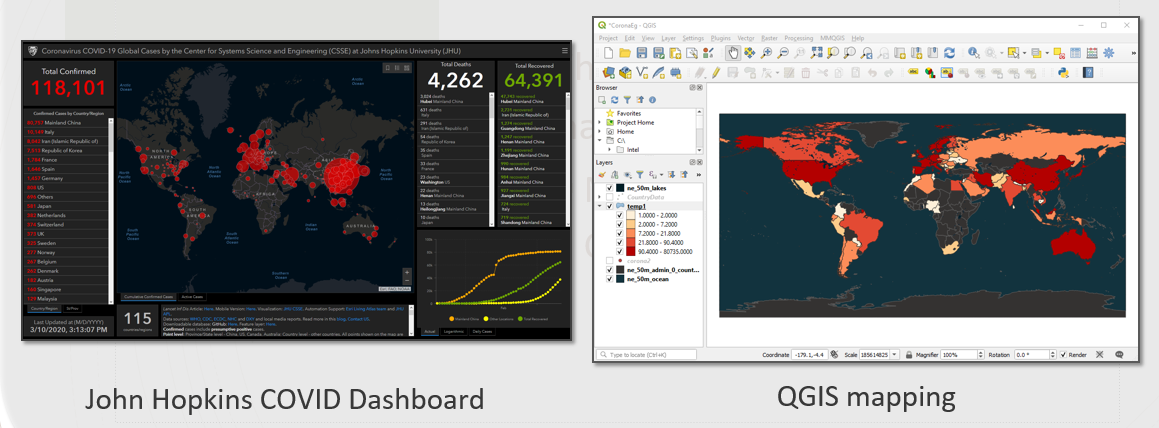
Rebuilding the John Hopkins Dashboard Map
Questions
meg.miller@umanitoba.ca
workshop: bit.ly/qgis_w2022