Infographics with Piktochart
Meg Miller - GIS & Data Visualization Librarian
workshop: bit.ly/uml_pik
Outline
- Define key terms;
- Discuss visualization types and their uses;
- Evaluate available infographic software;
- Piktochart Exercise:
- Explore Piktochart interface
- Create a simple infographic of climate summary data
Key Terms:
- Data Visualization: Display complex information in a way that makes it easier for your end user to explore or understand what you have done.
- Infographic: a collection of imagery, charts, and minimal text that gives an easy-to-understand overview of a topic or distills a theme
Example:
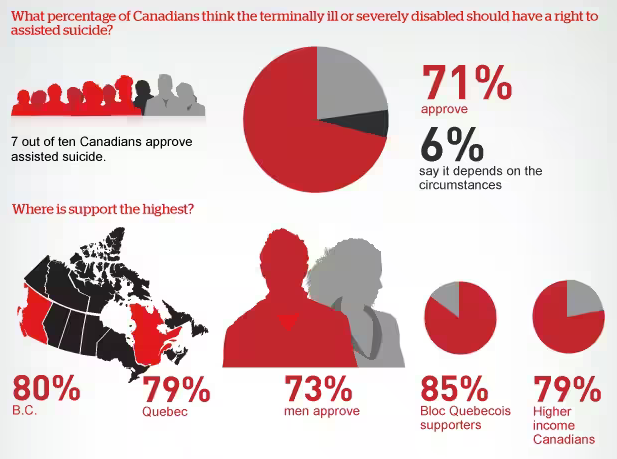
Source: CBC News
Getting Started:
Data Visualization LibGuide
Don't forget about training resources!
Infographic Considerations:
Message - be selective
Audience
Data - requirements and structure
Colour :
- Select color schemes appropriate to your data type (shade vs. hue).
- Keep things neutral with 2-3 accent colours maximum.
Use a tool like Color Picker help with colour selection.
Font:
- Font has personality, select combinations appropriate for your audience.
- Keep things simple: one decorative, one for body text.
Use a tool like FontPair help with font selection.
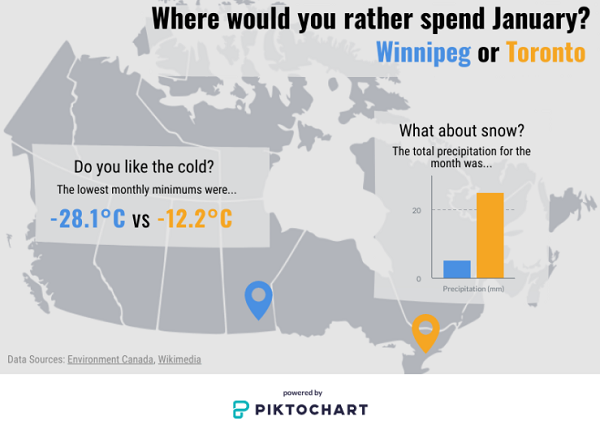
Example:

Source: CBC News
Piktochart – Building a bite-sized visual
Questions
meg.miller@umanitoba.ca
workshop: bit.ly/uml_pik