A very spatial software session
Meg Miller - GIS & Data Visualization Librarian
workspace: bit.ly/hist_7110
Outline
- What is GIS?
- Considerations for HGIS projects
- Data Visualization and Campus Libraries
- ArcGIS Online (workshop)
What is GIS?
Geographic Information System
Any system used to analyze, capture or work with geospatial data.
1. What data types are used in GIS
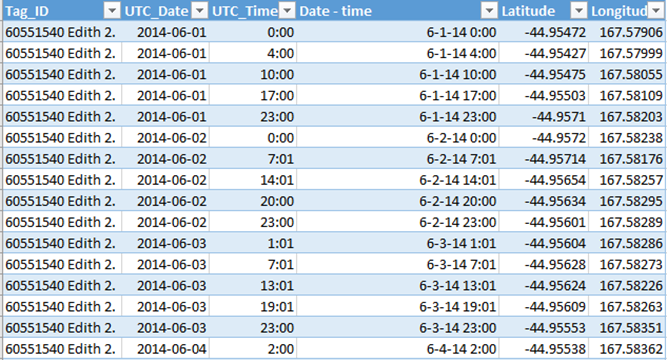
Data Types: Tabular
Data Types: Vector (point, line, polygon)

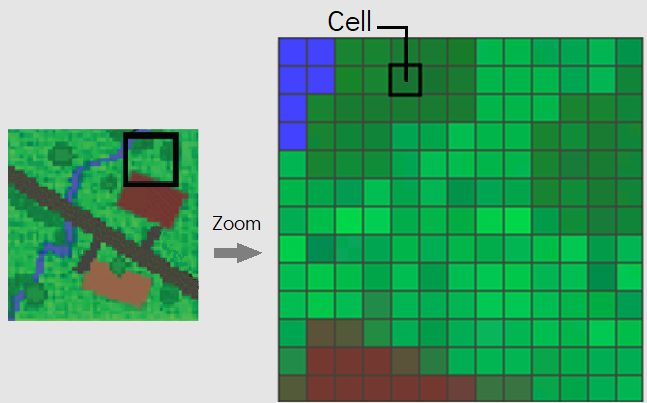
Data Types: Raster
2. Then what is HGIS
"GIS enabled historical consciousness"
Sasha Mullally- UNB History Dept.
Popular processes:
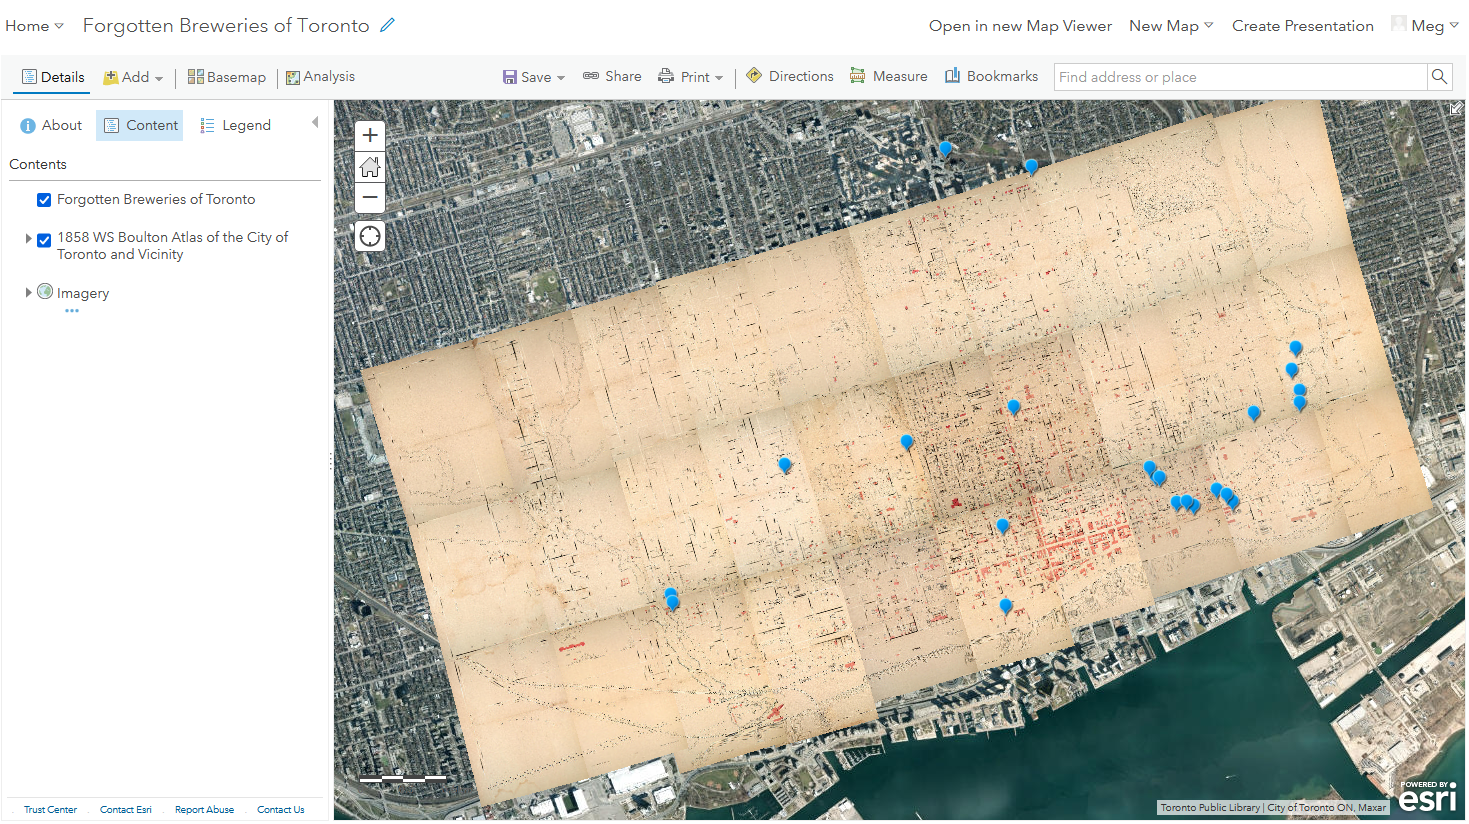
- Digitization of historical maps/images
- Reconstruction of features from the past
- Georeferencing microdata
- Revealing trends
Note
Be engaged.
Thanks to Vanessa Lillie, Cary Miller & Lyle Ford
for their insight in the following section.
Be conscientious (1)
- Data visualization theory is a colonial construct;
- Colour has connotation outside of your own world view;
Be conscientious (2)
- Who are you focussing on? Who is being erased?
- "Maps have killed more people than guns ever have" Dayrit (2020)
Considerations:
3. How can Libraries support me
Library Support:
Librarian Support
Subject Guides
Training opportunities
Key Points:
- Your expertise - be kind to your future self
- Purpose - exploratory vs. explanatory
- Audience - expertise, mediation
- Data requirements - size, residency, privacy...
Hands-on: Exploring ArcGIS Online
Questions
meg.miller@umanitoba.ca
workspace: bit.ly/hist_7110